GMV Max · TikTok Shop Ads5 min read
Context & challenge
These are aggregated figures from TikTok Shop stores where the LDH Media team directly runs GMV Max ads and store operations. Brand names are withheld under confidentiality agreements.
The stores span many different categories, but they shared several pain points before working with LDH Media:
- Ads ran in a scattered way, with no clear rhythm for scaling up or down.
- TikTok and Facebook ran at the same time, but there was no way to compare which channel performed better.
- Revenue depended on a few sale days, and stalled on normal days.
The shared goal: turn ads into a steady source of orders, keep ROI at a profitable level, and make the most of major sale events.
Diagnosis from the data
Headline results:
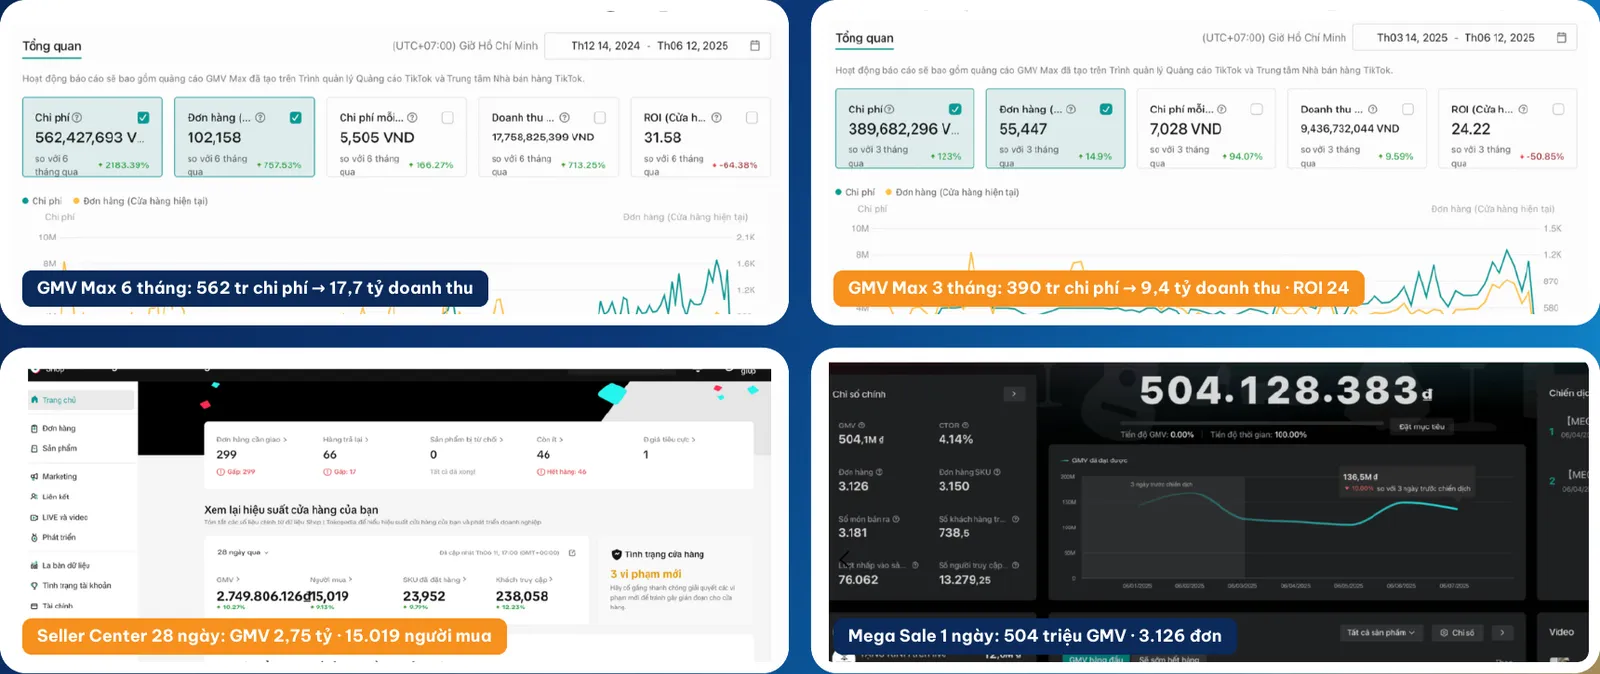
- 562 million VND in ad spend generated 17.7 billion VND in revenue.
- 390 million VND in spend generated 9.4 billion VND in revenue (ROI 24).
- 2.75 billion VND in revenue in 28 days.
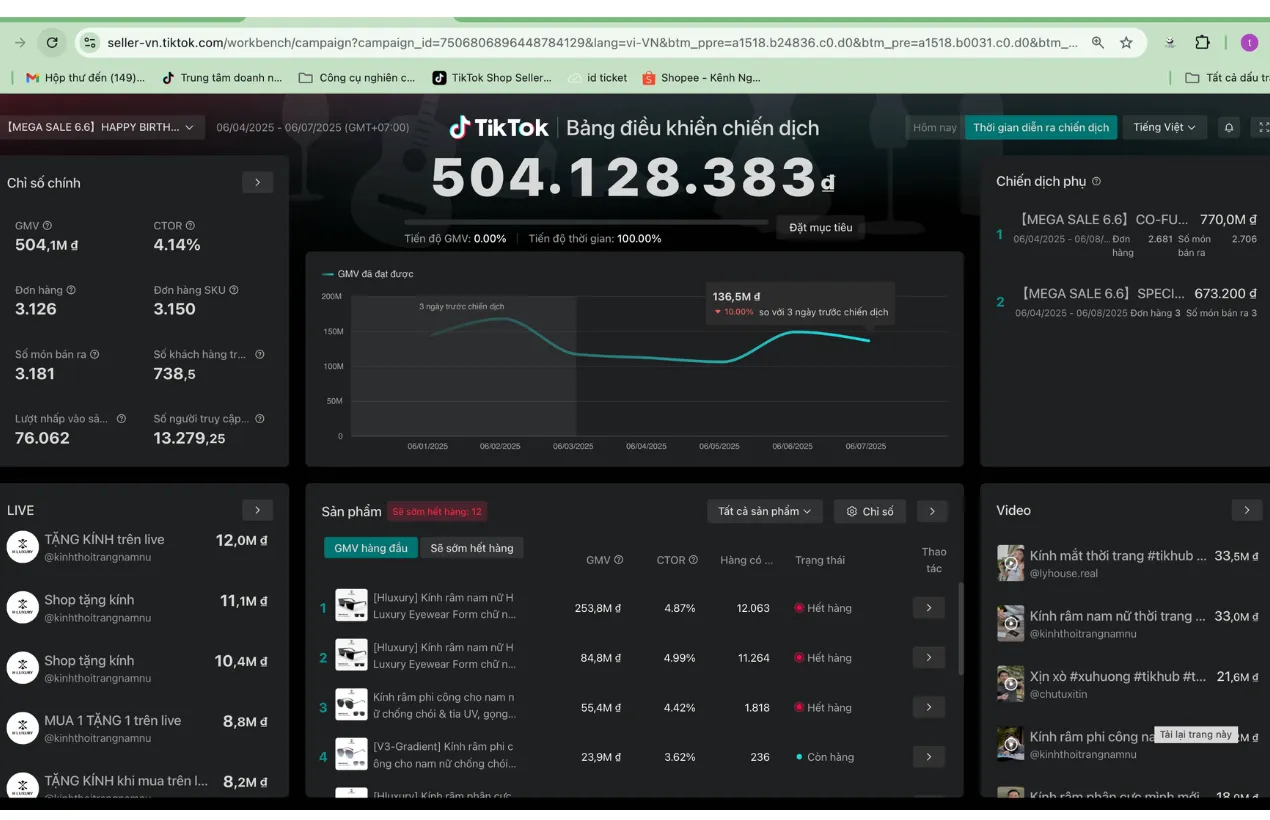
- The Mega Sale 6.6 campaign (04/06 – 07/06/2025) reached 504 million VND in GMV.
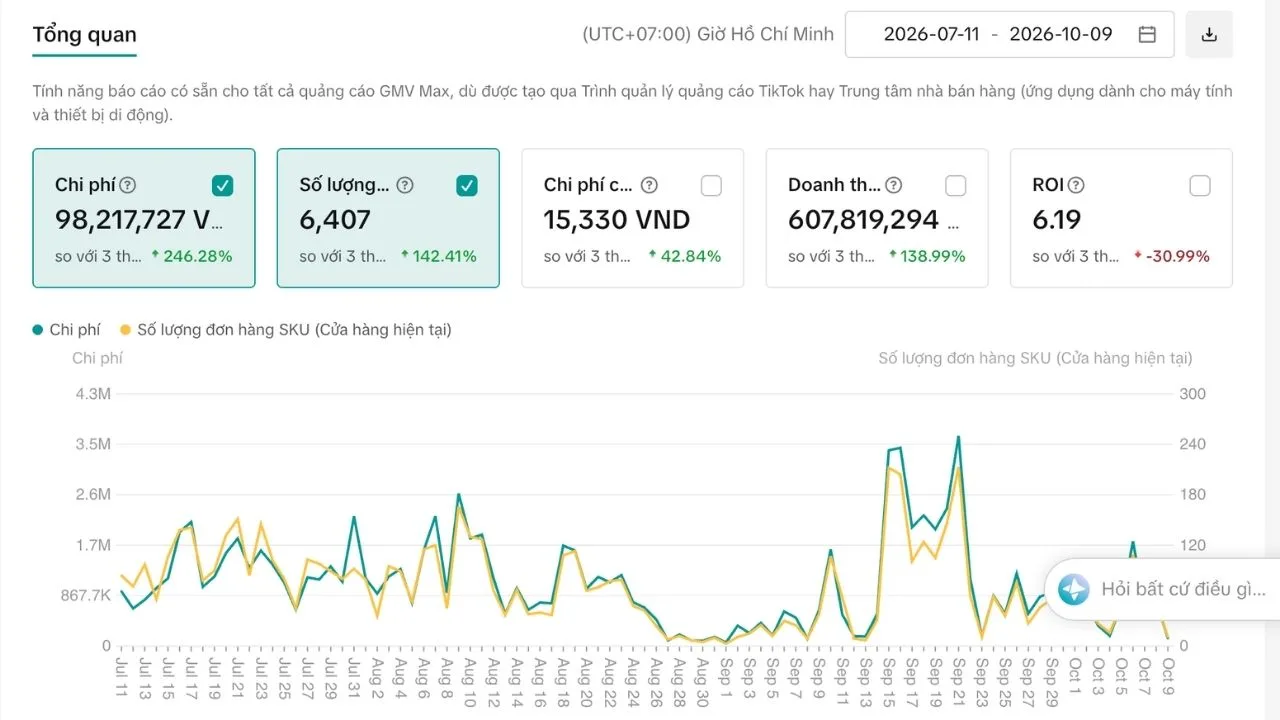
The cover image clearly labels two GMV Max dashboards: the 562 million VND dashboard covers 6 months (14/12/2024 – 12/06/2025) with 102,158 orders; the 390 million VND dashboard covers 3 months (14/03 – 12/06/2025) with 55,447 orders.
Calculated from the dashboard data:
| Dashboard | ROI | Cost per order | Average order value (AOV) |
|---|---|---|---|
| 562M → 17.7B VND (6 months) | ≈ 31.5 | ≈ 5,500 VND | ≈ 173,800 VND |
| 390M → 9.4B VND (3 months) | 24 | ≈ 7,000 VND | ≈ 170,200 VND |
The good news: order value is almost identical across the two dashboards, at around 170 thousand VND. Cost per order is very low, only about 5,500 – 7,000 VND. This is the foundation for an ROI above 20.
The bottleneck: both dashboards end on 12/06/2025, and the 3-month window has a higher cost per order and a lower ROI than the 6-month window. The image does not show whether the two dashboards belong to the same store. If they do, this signals that efficiency in the recent period declined as budget increased — a familiar pattern when scaling.
Growth strategy
This is the framework LDH Media applies to multi-category stores running ads on TikTok Shop.
Phase 1 – Foundation: standardise measurement
- Track GMV Max in Ads Manager and revenue in Seller Center over the same time window.
- Set a break-even ROI for each category, since profit margins differ.
- Separate TikTok and Facebook metrics for a fair comparison.
Phase 2 – Activation: ads paired with content
- Use sales videos, KOC videos and LIVE sessions as creative sources for GMV Max.
- Only videos that generate orders get scaled; fatigued videos are replaced.
- On Facebook, separate conversion ads from livestream ads, as their performance differs greatly.
Phase 3 – Scale: concentrate on sale events
- Prepare inventory, promotions and content ahead of Mega Sale events.
- Raise budget on sale days, then bring it back to the baseline after the sale.
- Review at the 30 · 60 · 90-day milestones.
Results
TikTok GMV Max
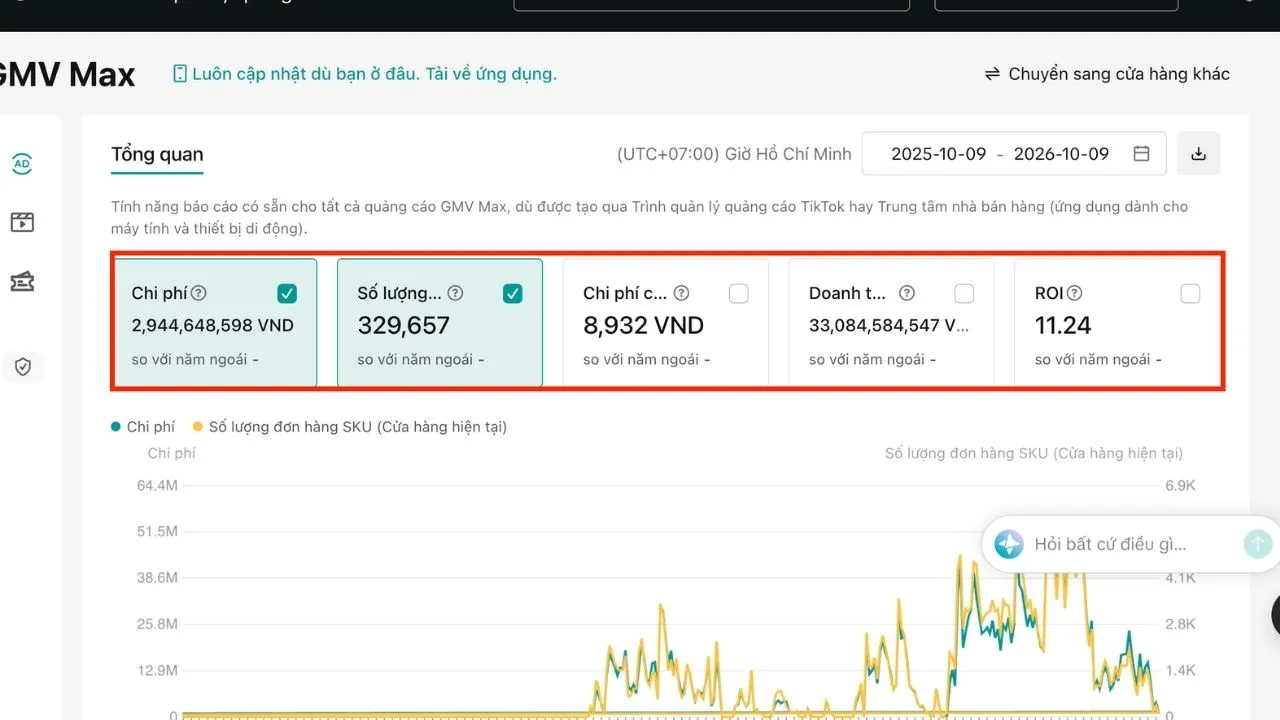
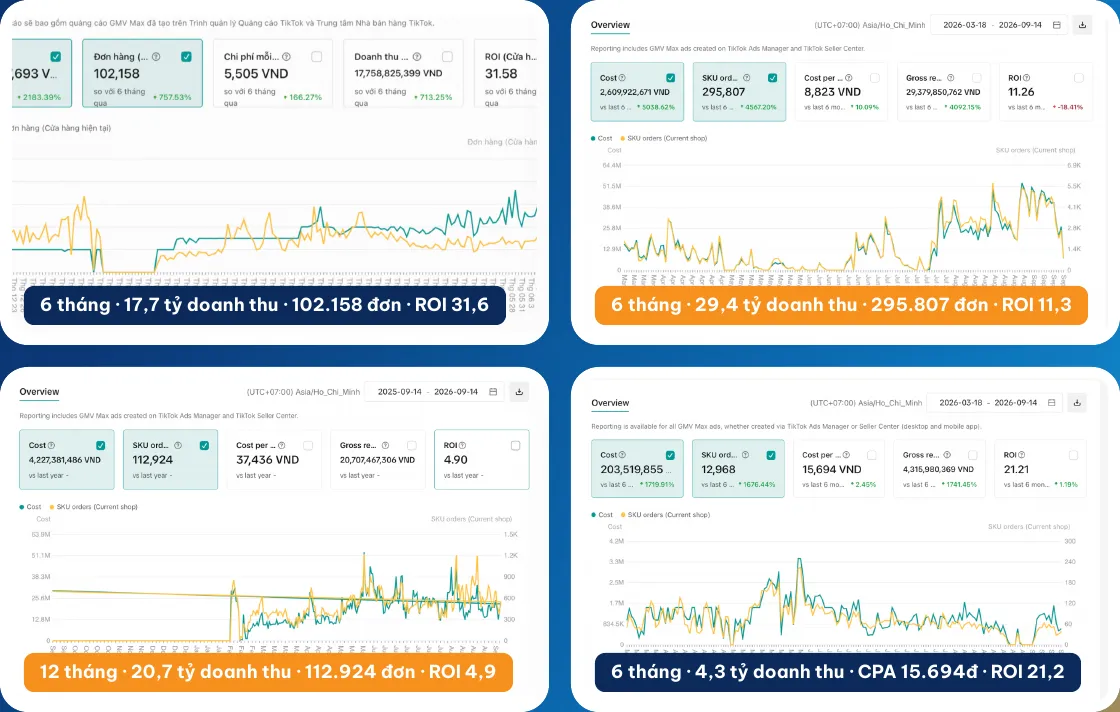
ROI of 11–31, with more than 500K SKU orders coming from ads. Stores reached revenues of 17.7 / 29.4 / 20.7 / 4.3 billion VND.
Facebook Ads
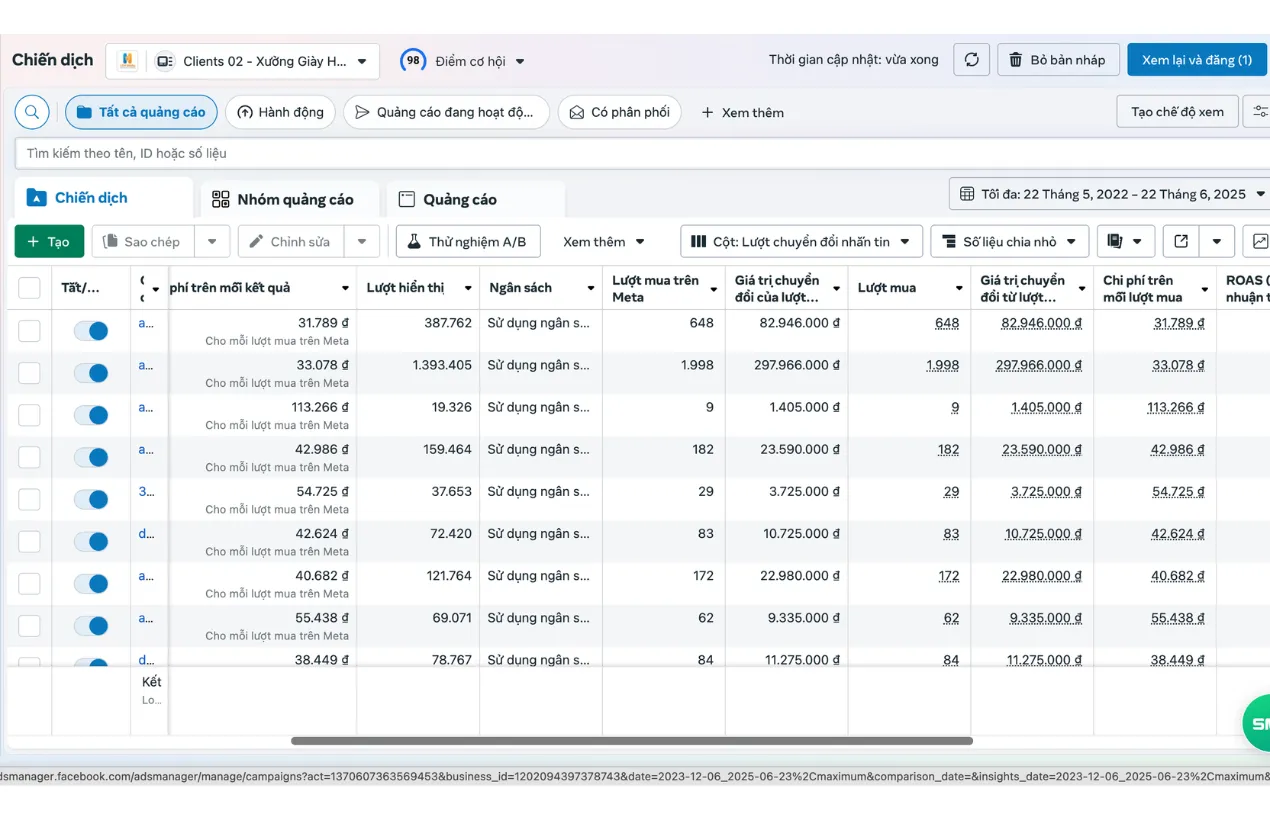
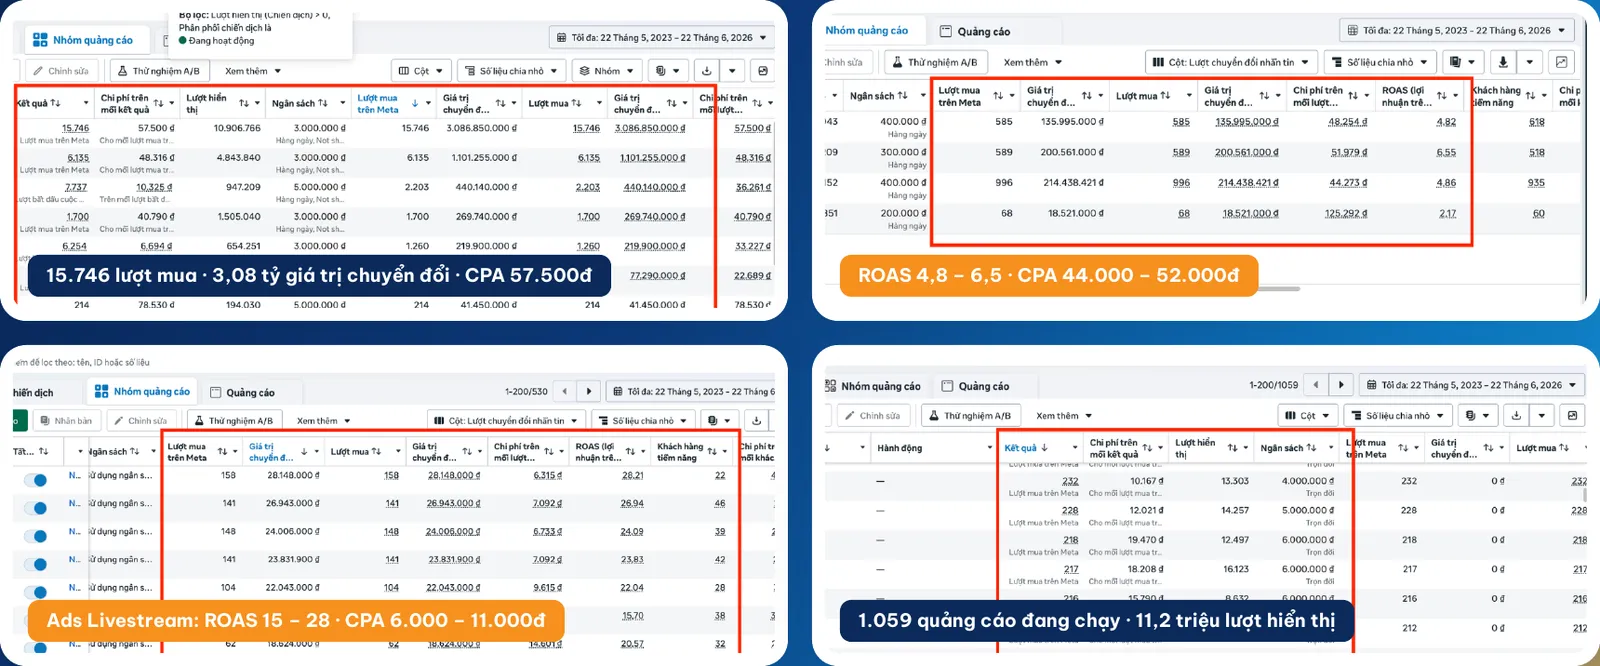
15,746 purchases and 3.08 billion VND in conversion value; ROAS 4.8–6.5. Livestream ads alone reached ROAS 15–28.
| Channel | Key metrics |
|---|---|
| TikTok GMV Max | ROI 11–31, more than 500K SKU orders |
| Facebook conversion ads | ROAS 4.8–6.5, 15,746 purchases |
| Facebook livestream ads | ROAS 15–28 |
| Seller Center | 2.75B VND in revenue in 28 days |
| Mega Sale 6.6 (04/06 – 07/06/2025) | 504M VND in GMV, 3,126 orders |
Analysis: where the growth came from
The ad dashboards do not show visitor counts per campaign, so revenue is broken down as:
Revenue = Number of orders × Order value, and ROI = Order value ÷ Cost per order.
For the two GMV Max dashboards above, order value is almost unchanged. So the difference in ROI comes almost entirely from cost per order: ≈ 5,500 VND for ROI ≈ 31.5, and ≈ 7,000 VND for ROI 24.
Comparing the two channels:
- Facebook conversion ads: each purchase brought in about 195,600 VND in conversion value (3.08B ÷ 15,746, calculated from the data). ROAS of 4.8–6.5 is several times lower than GMV Max.
- Facebook livestream ads: ROAS 15–28, close to GMV Max. Livestreams close orders within the session, while viewers are in a buying mood.
- TikTok GMV Max: ROI 11–31, because viewers can buy right inside TikTok Shop without leaving the app.
What did not go so well:
- ROI varies widely (11–31). Each category and each period produces a different ROI. The highest ROI should not be used as a common target for every store.
- Efficiency tends to drop when scaling. The 3-month window has a lower ROI than the 6-month window. Fresh creative is needed to hold cost per order.
- Revenue depends on sale events. 504 million VND in GMV over a few Mega Sale days is a high figure, but normal days need a steadier flow of orders from videos and LIVE sessions.
- Facebook conversion ads have a lower ROAS. Facebook should be used for suitable goals (livestream, new customers) rather than compared directly with GMV Max.
Lessons for store owners
- Measure each channel by its own yardstick. For GMV Max, look at ROI and cost per order. For Facebook, look at ROAS and cost per purchase.
- Keep order value stable when scaling. When order value holds steady, tightly managing cost per order is enough to protect ROI.
- Livestream is a lever for both TikTok and Facebook. Facebook livestream ads reached ROAS 15–28.
- Prepare thoroughly for sale days. A Mega Sale lasting a few days can bring in 504 million VND in GMV if inventory, promotions and content are ready.
- Track the numbers daily. Spotting weak ads early avoids losing a whole week of budget.
Actual results depend on product, price, inventory, budget and platform policies. This is not a commitment to results for every client.
Is this your situation?
- The store sells on TikTok Shop, but ads run in a scattered way, changing every month, with no clarity on which channel actually makes money.
- Running both TikTok and Facebook without being able to compare performance; at month-end all you see is the total ad spend.
- Orders flood in on sale days but trickle in on normal days, so revenue swings up and down.
- Nobody tracks the numbers daily; by the time a weak ad is spotted, a whole week of budget is gone.
LDH Media audits your store or ad account for free and points out the 3 things to fix first — based on real data, not sales promises.
Project images & data