GMV Max · TikTok Shop Ads5 min read
Context & challenge
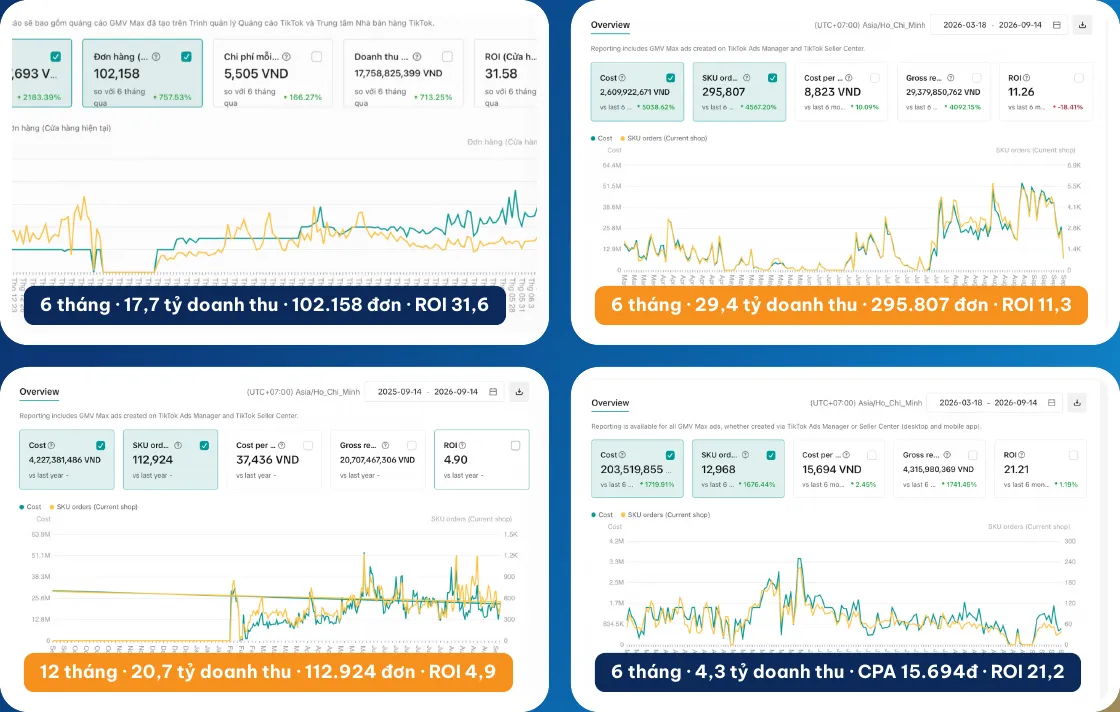
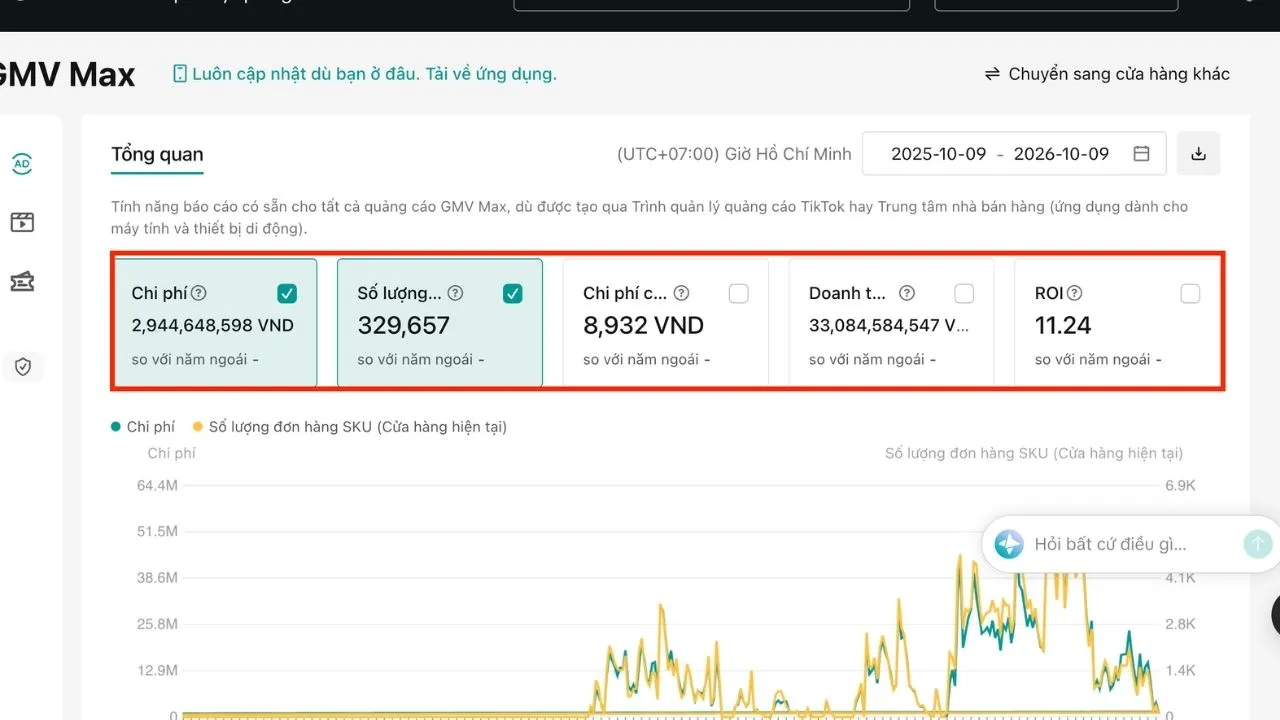
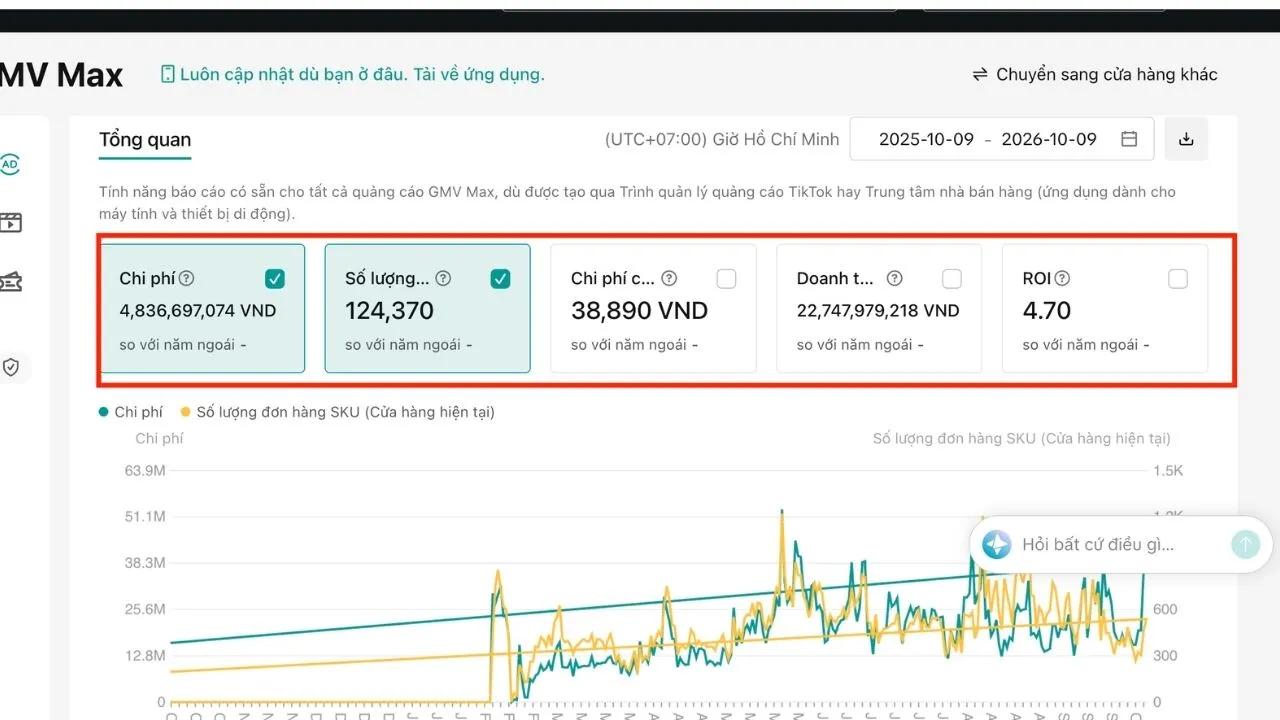
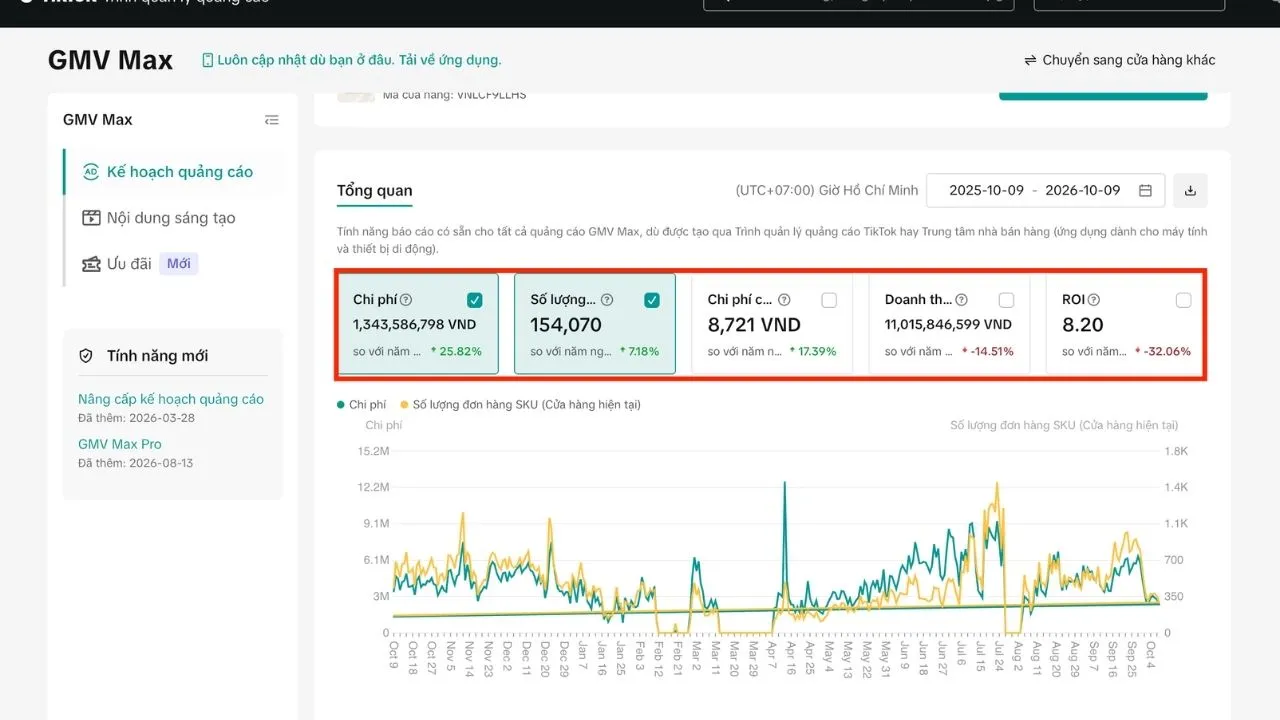
These figures are taken directly from the GMV Max (TikTok Ads Manager) screens of 3 TikTok Shop stores where the LDH Media team runs ads, for the period 09/10/2025 – 09/10/2026. Brand names are withheld under confidentiality agreements; the figures are kept exactly as shown on the dashboards.
The three stores have something in common: they are past the testing stage and spend billions of VND a year on ads. At this scale, the owner’s worry is no longer “will ads bring in orders?” The worries are:
- How much was spent over the year, how much came back, and what is the real ROI?
- If budget goes up further, is it still profitable?
- How can ad cash flow be managed transparently, with proper documentation?
The goal: keep GMV Max as the main order channel, grow scale while still controlling cost per order for each store.
Diagnosis from the data
| Store | Ad spend | GMV Max revenue | SKU orders | ROI |
|---|---|---|---|---|
| Store 1 | 2,944,648,598 VND | 33,084,584,547 VND | 329,657 | 11.24 |
| Store 2 | 4,836,697,074 VND | 22,747,979,218 VND | 124,370 | 4.70 |
| Store 3 | 1,343,586,798 VND | 11,015,846,599 VND | 154,070 | 8.20 |
Calculated from the dashboard data:
| Store | Cost per order | Average order value (AOV) |
|---|---|---|
| Store 1 | ≈ 8,900 VND | ≈ 100,400 VND |
| Store 2 | ≈ 38,900 VND | ≈ 182,900 VND |
| Store 3 | ≈ 8,700 VND | ≈ 71,500 VND |
All 3 stores combined (calculated from the dashboards): spend ≈ 9.12 billion VND, revenue ≈ 66.85 billion VND, 608,097 SKU orders, overall ROI ≈ 7.33.
Quick read:
- Store 1 is the most efficient model: low cost per order, mid-range order value, ROI 11.24.
- Store 2 spent the most but has the lowest ROI. The bottleneck is a cost per order more than 4 times that of store 1. A higher order value only partly offsets it.
- Store 3 has the lowest cost per order but also the lowest order value. ROI 8.20 is the result of low-priced products sold in large volume.
Store 2’s chart shows that daily spend only starts appearing from around early February 2026. That means its “12-month” data is effectively concentrated in about 8 months. Store 3 has a few stretches of almost zero spend, around February – April and early August 2026.
Growth strategy
This is the framework LDH Media applies to stores running GMV Max at a scale of billions of VND a year.
Phase 1 – Foundation: choose the right products and signals
- Concentrate budget on product groups with good conversion rates rather than spreading it evenly across the whole catalogue.
- Set a separate break-even ROI for each store based on profit margin.
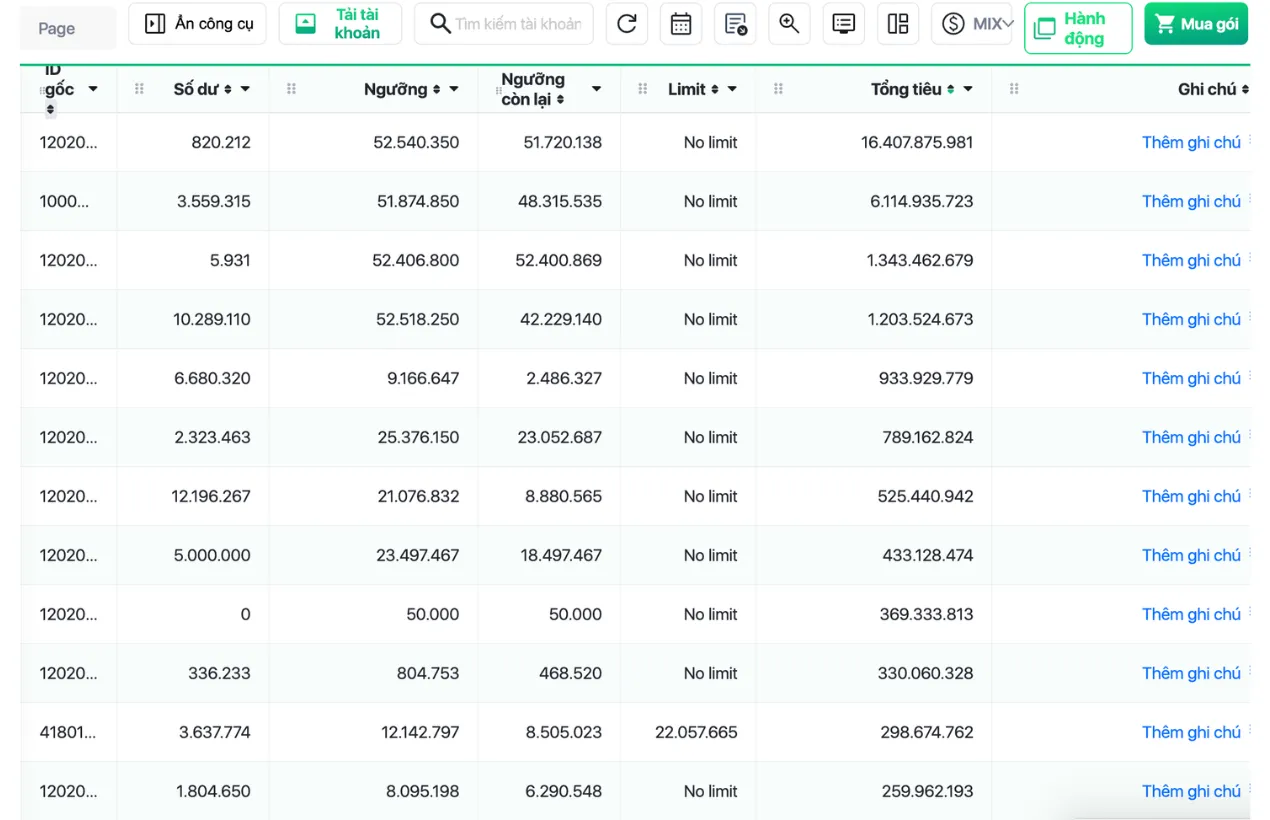
- Use transparent ad accounts: budget is topped up into the brand’s own account, and VAT invoices can be issued when using LDH Media’s Agency account.
Phase 2 – Activation: ads paired with creative
- Use sales videos, affiliate KOC videos and LIVE sessions as creative sources for GMV Max.
- Only videos that generate orders get scaled. Fatigued videos are replaced with new ones using the same selling angle.
- Track ROI daily, evaluate at the 30 · 60 · 90-day milestones.
Phase 3 – Scale: follow seasonality and data
- Raise budget for major sale events and pull back when the market is slow.
- Scale up or down based on Seller Center and Ads Manager data rather than gut feeling.
- Track each store’s cost per order to know when to stop increasing.
Results
| Metric | Store 1 | Store 2 | Store 3 |
|---|---|---|---|
| Spend | 2.94B VND | 4.84B VND | 1.34B VND |
| GMV Max revenue | 33.08B VND | 22.75B VND | 11.02B VND |
| SKU orders | 329,657 | 124,370 | 154,070 |
| ROI | 11.24 | 4.70 | 8.20 |
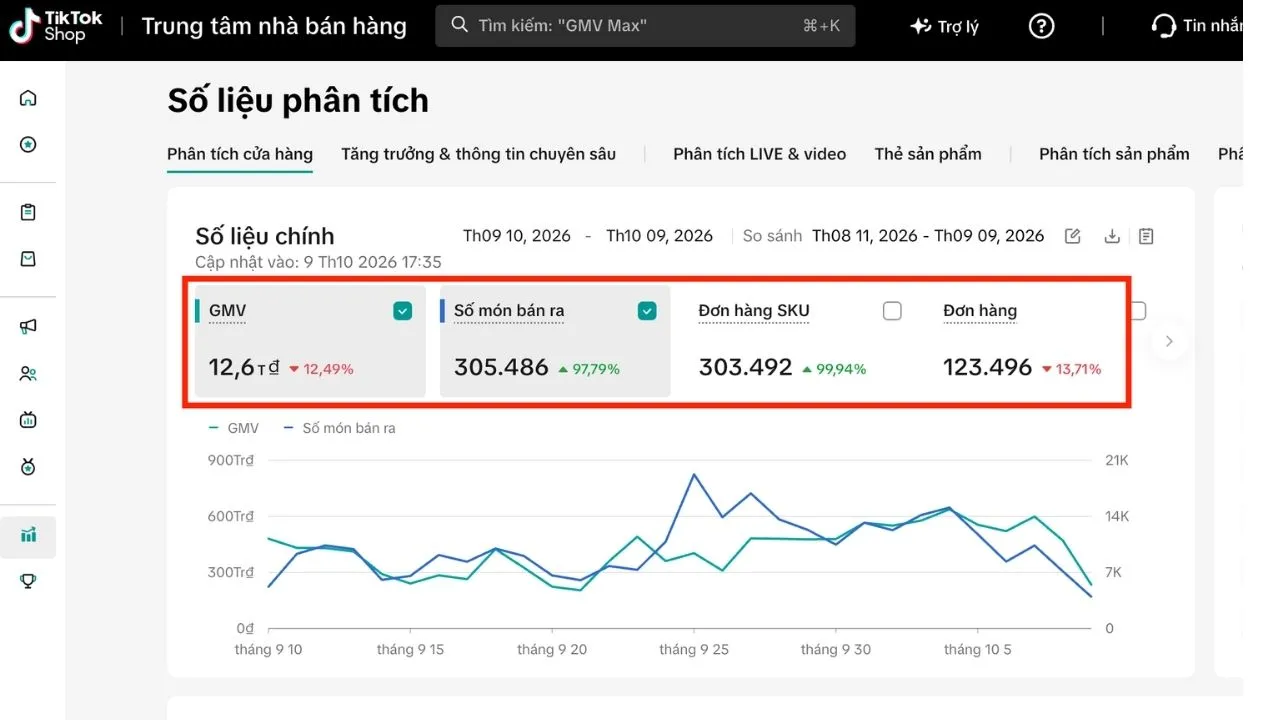
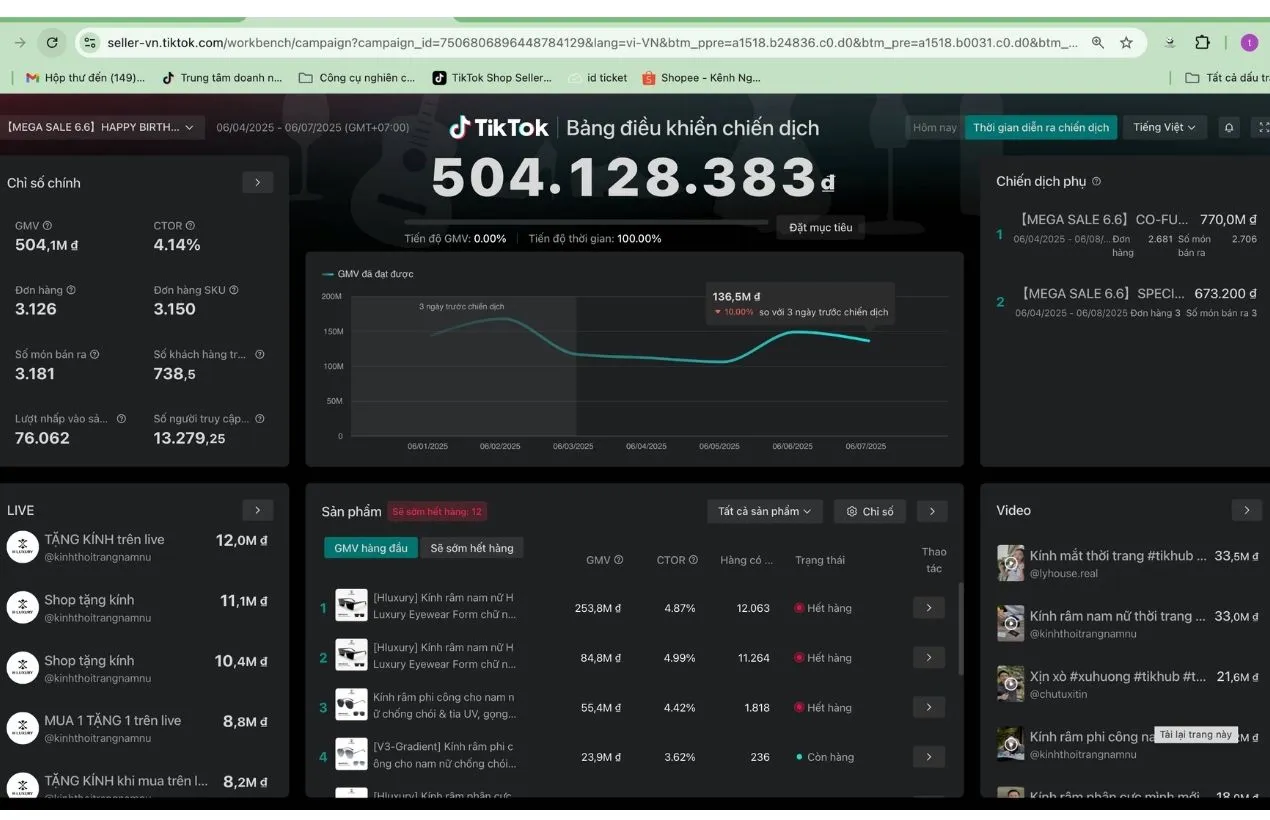
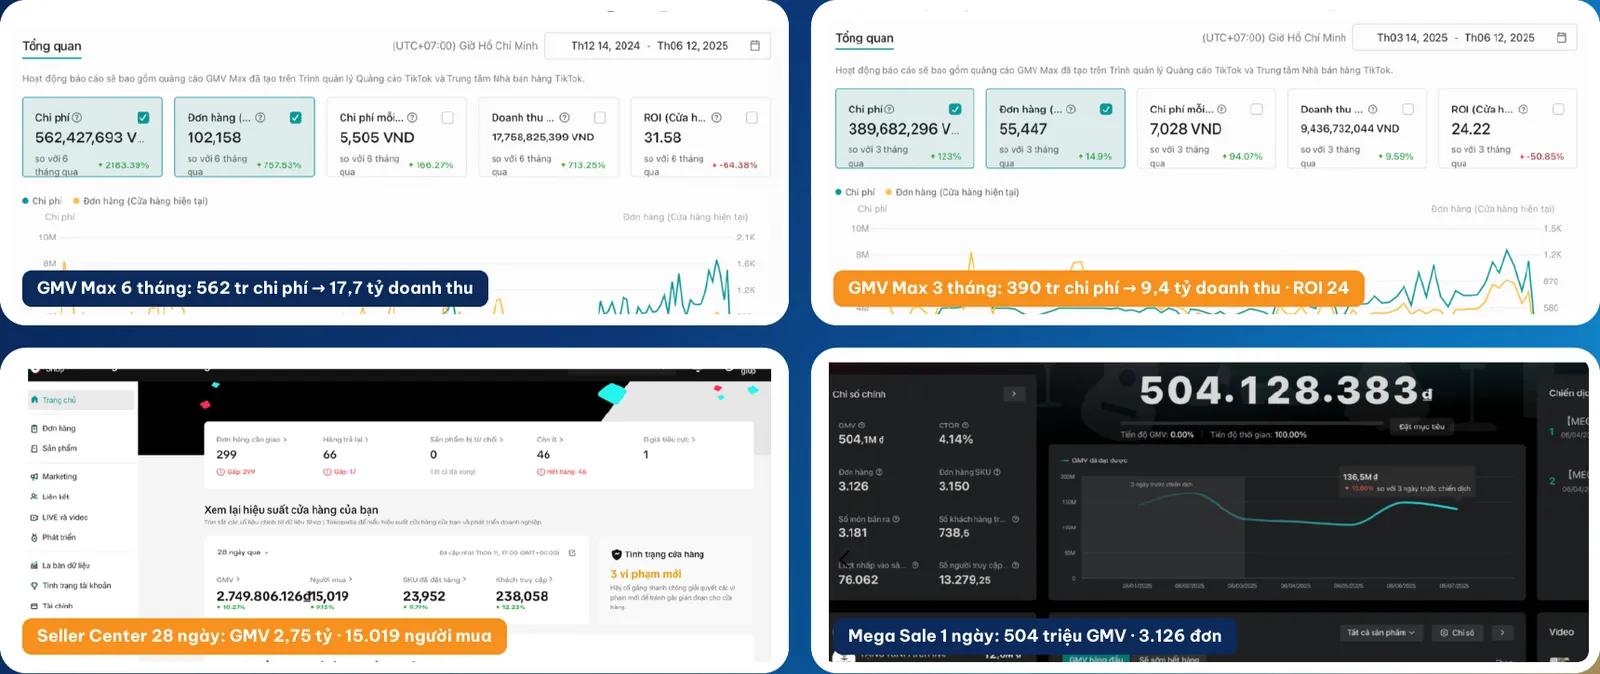
At store level, another store supported by LDH Media reached 12.61 billion VND in GMV with 305,486 products sold in 30 days (10/09 – 09/10/2026). Another store recorded 504 million VND in GMV during the Mega Sale 6.6 campaign.
Analysis: where the growth came from
The GMV Max dashboard has no visitor count, so revenue is broken down as:
Revenue = Orders × Order value, and ROI = Order value ÷ Cost per order.
Comparing store 1 and store 2 (calculated from the dashboards):
- Store 1 has about 2.65 times as many orders as store 2.
- Store 1’s order value is only about 55% of store 2’s.
- Multiplied together, store 1’s revenue is about 45% higher, even though its spend is about 39% lower.
So store 1’s strength lies in a very large number of orders at a low cost per order. This is usually a sign of products that are easy to rebuy, moderately priced, with a stable creative pipeline.
The weaker points, faced squarely:
- Store 2 has an ROI of 4.70. In categories with thin margins, this may be only around break-even. The fix: review product groups that spend a lot with few orders, refresh creative, and consider cutting budget on days when cost per order exceeds the threshold.
- Performance is uneven over time. All three stores’ charts fluctuate strongly by day and by sale event. There are stretches of almost no spend. Looking at a single month in isolation easily leads to wrong conclusions.
- Spending more does not mean higher ROI. The store with the largest spend has the lowest ROI of the three.
Lessons for store owners
- Set break-even ROI before raising budget. The right ROI level depends on each category’s profit margin.
- Read the data over long cycles. Only over 3 – 12 months does true performance show, because spend and orders swing strongly by day and by sale event.
- SKU orders are a measure of scale. The three stores recorded a combined 608,097 SKU orders from GMV Max in 12 months.
- Compare cost per order across stores. This metric shows which store needs fresh creative or a product review.
- Manage ad accounts with proper documentation. At a scale of billions of VND, VAT invoices and transparent accounts keep the accounting clear.
Actual results depend on product, price, inventory, budget and platform policies. This is not a commitment to results for every client.
Is this your situation?
- After a few months of ads, some periods are profitable and some aren't, and you don't know what the whole year actually added up to.
- Monthly ad budget is already in the hundreds of millions of VND, but it's still managed by gut feeling.
- Raising spend does raise revenue, but you're not sure profit rises with it.
- You need VAT invoices for ad spend for accounting, but top-ups via a personal card can't be invoiced.
LDH Media audits your store or ad account for free and points out the 3 things to fix first — based on real data, not sales promises.
Project images & data