GMV Max · TikTok Shop Ads5 min read
Context & challenge
This store had already been running GMV Max with a good ROI. The problem was scale. In the three months before the reporting period, ad spend was only about 28 million VND (estimated from the dashboard). The brand name and category are withheld by agreement.
The owner faced the question almost every seller runs into: should you raise the budget while ads are profitable? Raise it and ROI may drop. Don’t, and revenue stands still.
Goals for 11/07 – 09/10/2026:
- Sharply increase orders and revenue from ads.
- Accept a lower ROI, as long as ROI stays above break-even.
- Know exactly how much revenue each extra dong of spend brings in.
Diagnosis from the data
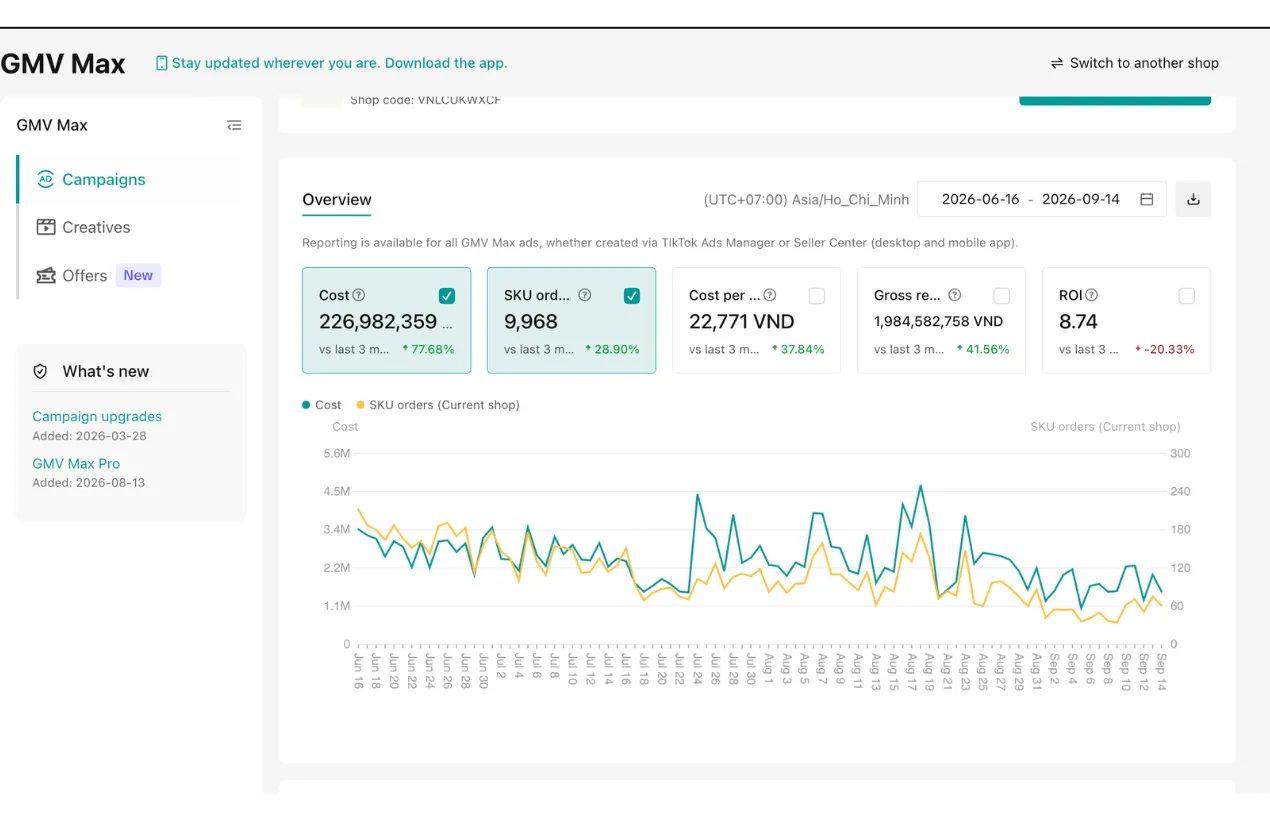
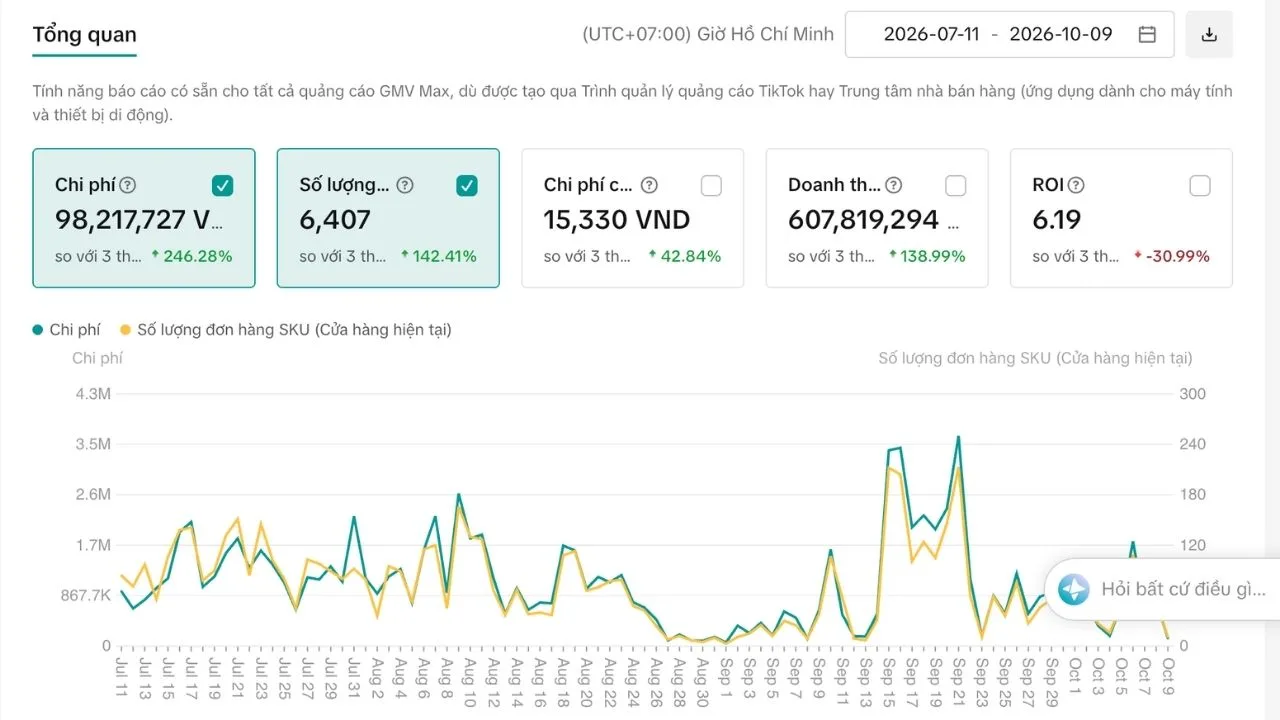
GMV Max dashboard for 11/07 – 09/10/2026, compared with the previous 3 months:
- Spend: 98,217,727 VND (+246.28%).
- SKU orders: 6,407 (+142.41%).
- Cost per order: 15,330 VND (+42.84%).
- Revenue: 607,819,294 VND (+138.99%).
- ROI: 6.19 (−30.99%).
The previous period worked out backwards (estimates, calculated from the dashboard data):
| Metric | Previous 3 months (estimate) | This period |
|---|---|---|
| Spend | ≈ 28.4 million VND | 98.2 million VND |
| SKU orders | ≈ 2,643 | 6,407 |
| Cost per order | ≈ 10,700 VND | 15,330 VND |
| Revenue | ≈ 254.3 million VND | 607.8 million VND |
| ROI | ≈ 8.97 | 6.19 |
| Average order value (AOV) | ≈ 96,200 VND | ≈ 94,900 VND |
The good signs: orders and revenue both more than doubled. Order value held almost steady, slipping only about 1.4%. That means the store did not have to cut prices to win more orders.
The bottleneck: cost per order rose 42.84%. Spend rose almost 3.5 times, while orders rose about 2.4 times. This is the “price” of scaling: the algorithm has to find more buyers among groups that are harder to convert.
Growth strategy
This is the framework LDH Media applies to stores that already have a good ROI and want to scale.
Phase 1 – Foundation (set the thresholds)
- Calculate break-even ROI from the gross margin of the hero products.
- Set a minimum acceptable ROI for scaling, a safe margin above break-even.
- Check inventory before raising budget so stock doesn’t run out mid-way.
Phase 2 – Activation (raise in steps)
- Raise budget step by step, holding for a few days so the algorithm stabilises before the next increase.
- Add new videos for hero products so the algorithm has more material.
- Track cost per order daily against the threshold that was set.
Phase 3 – Scale (follow the sale rhythm)
- Push budget hard during sale events, when organic conversion rates are high.
- Bring budget back to the baseline after the sale, avoiding heavy spend on slow-order days.
- Re-evaluate using marginal ROI (extra revenue / extra spend), not just average ROI.
Results
| Metric | Result (11/07 – 09/10/2026) | Vs. previous 3 months |
|---|---|---|
| Spend | 98,217,727 VND | +246.28% |
| SKU orders | 6,407 | +142.41% |
| Cost per order | 15,330 VND | +42.84% |
| Revenue | 607,819,294 VND | +138.99% |
| ROI | 6.19 | −30.99% |
The chart on the dashboard shows spend and orders moving almost in parallel day by day. In late August – early September there was a period when spend and orders were both low. In mid-September, both spiked and then came down — a sign that budget was concentrated around sales pushes.
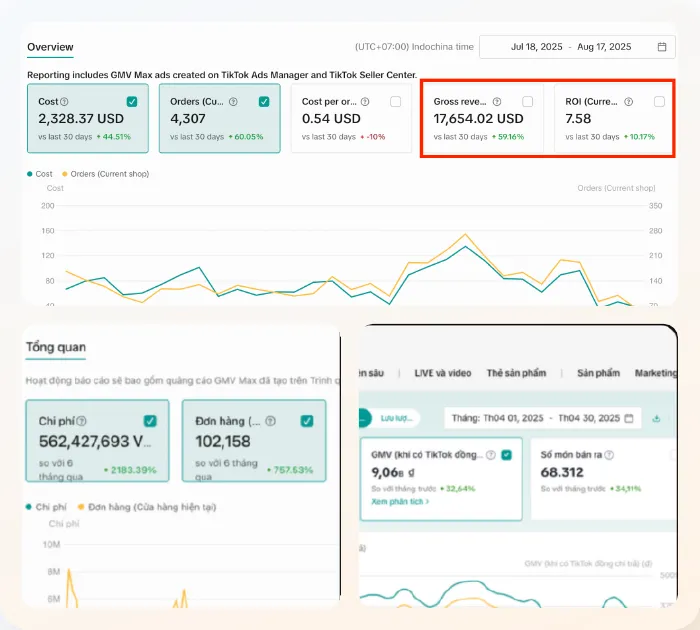
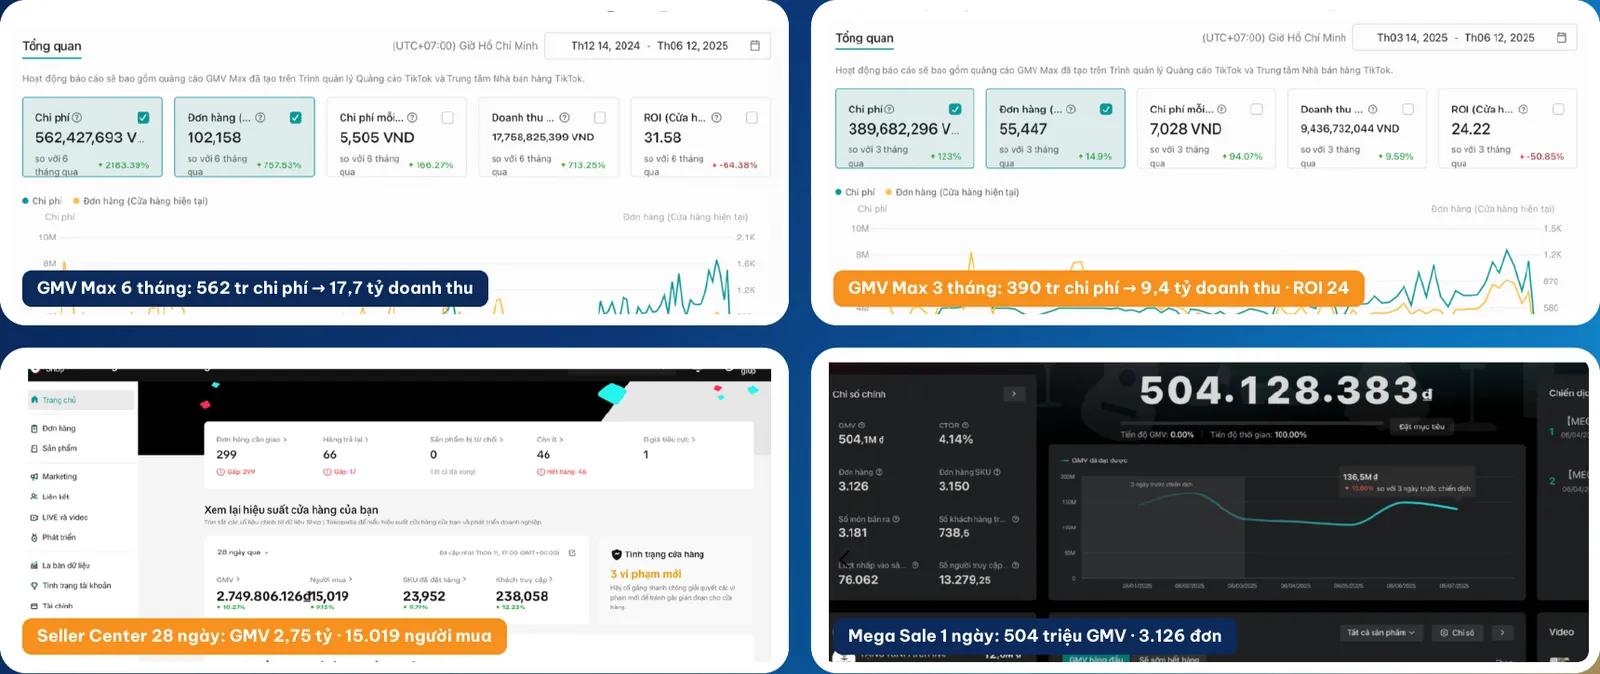
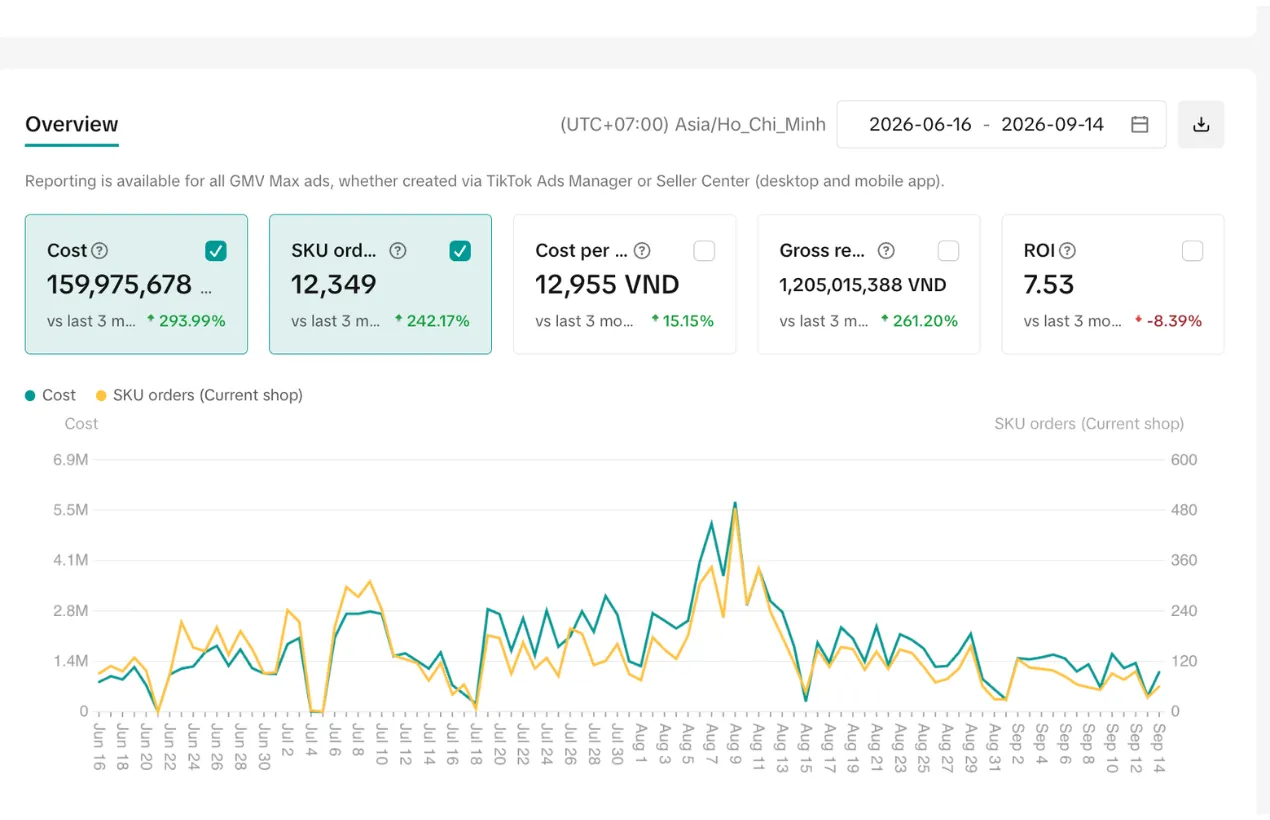
For comparison, here is another GMV Max dashboard that also scaled strongly over 3 months:
Analysis: where the growth came from
The GMV Max dashboard has no visitor count, so revenue is broken down as follows:
Revenue = Orders × Order value, where Orders = Spend ÷ Cost per order.
Calculated from the dashboard data:
- Spend rose about 3.46 times.
- Cost per order rose about 1.43 times, so orders rose only about 3.46 ÷ 1.43 ≈ 2.42 times.
- Order value stayed almost unchanged (×0.99).
Result: revenue rose about 2.39 times, matching +138.99%.
The more important question is whether the extra spend was worth it. Calculated from the dashboard (estimates):
- Extra spend ≈ 69.9 million VND.
- Extra revenue ≈ 353.5 million VND.
- Extra orders ≈ 3,764.
- Marginal ROI ≈ 5.06, with cost per extra order ≈ 18,600 VND.
Average ROI fell from ≈ 8.97 to 6.19. But each extra dong spent still brought in about 5 dong of revenue. If the product’s break-even ROI is below 5, the extra spend still generated profit. If break-even ROI is above 5, the store has over-scaled and should step back one level.
The weaker points:
- Cost per order rising 42.84% is a significant increase. New videos are needed to bring cost down, rather than relying on budget alone.
- Performance is uneven day to day. In late August, spend and orders were both low, showing that market demand slows at times. Budget should flex with demand.
- Marginal ROI is well below average ROI. If budget keeps rising with the same creative pool, marginal ROI may fall further.
Lessons for store owners
- ROI falling while scaling is normal. The question to ask is whether marginal ROI is still above break-even.
- Calculate marginal ROI before deciding. Divide extra revenue by extra spend. This number tells you whether the last dong spent is still profitable.
- Keep order value stable. This case did not cut prices to get orders, so revenue rose almost in line with order count.
- Raise in steps, not all at once. The algorithm needs time to find more buyers at the new spend level.
- Scale together with creative. If budget rises but videos stay the same, cost per order will almost certainly go up.
Actual results depend on product, price, inventory, budget and platform policies. This is not a commitment to results for every client.
Is this your situation?
- Ads are profitable and you want to raise the budget, but you're afraid ROI will drop once you do.
- You once doubled the budget in one go, saw cost per order jump a few days later, and cut it back again.
- A falling ROI is worrying, but you don't know whether total profit at month-end went up or down.
- Orders are few on normal days, ads spend fast on sale days, and you're not sure how to set the budget sensibly.
LDH Media audits your store or ad account for free and points out the 3 things to fix first — based on real data, not sales promises.
Project images & data