GMV Max · TikTok Shop Ads7 min read
Context & challenge
The question LDH Media gets most often when advising on GMV Max is: “What ROI is good?”
A store running at ROI 5 often feels it is underperforming when it hears someone else mention ROI 20. But those two numbers may come from two completely different products, price points and stages.
This article brings together 19 GMV Max dashboards/periods that LDH Media has published to answer: why does the same tool produce ROI anywhere from 4.5 to 31.6?
A note when reading: these are dashboards/periods, not necessarily 19 different stores. Some dashboards may be the same store over different time windows, so the article does not add up figures across rows.
Diagnosis from the data
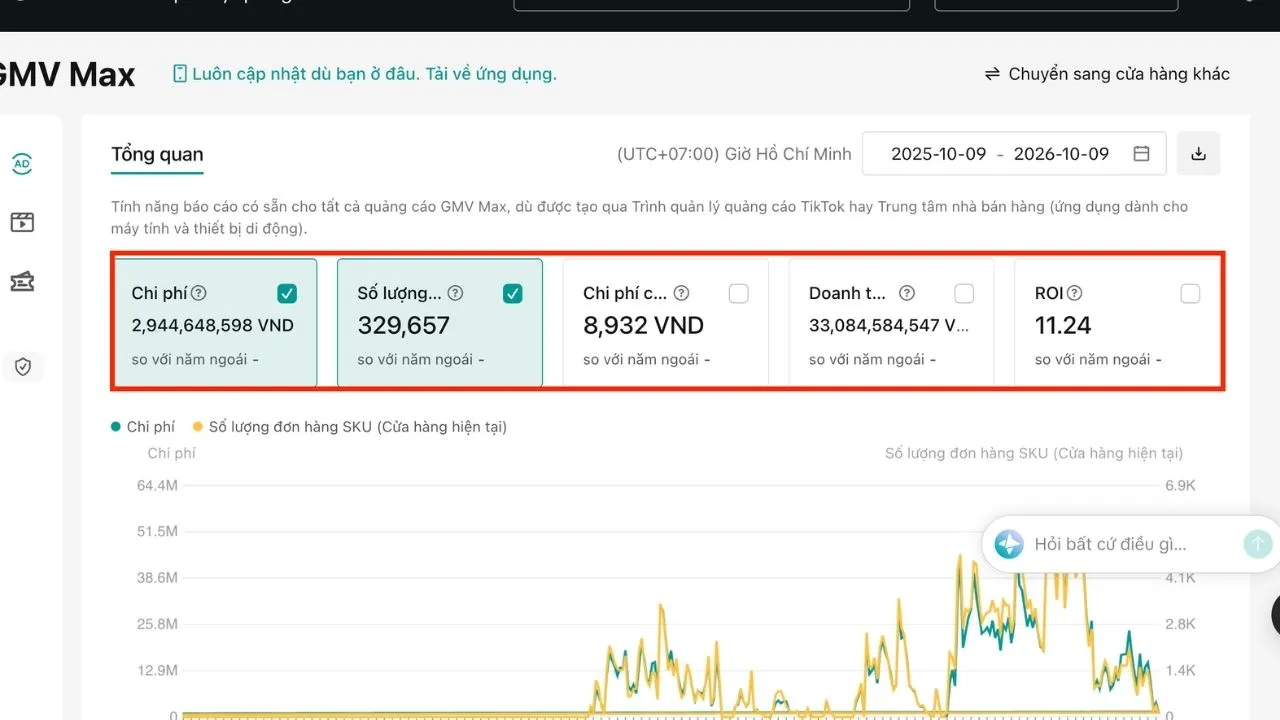
The table is sorted by ascending ROI. The 12-month case covers 09/10/2025 – 09/10/2026.
| Dashboard / period | Duration | Spend (VND) | Revenue (VND) | Orders | ROI |
|---|---|---|---|---|---|
| New store starting out (11/07 – 09/10/2026) | 3 months | 222.7M | 1.01B | 6,647 | 4.54 |
| Store 2, 12-month case | 12 months | 4.84B | 22.75B | 124,370 | 4.70 |
| Dế Mèn Vi Sinh (~6 months from 04/2026) | ~6 months | 2.76B | 13.03B | 143,699 | 4.72 |
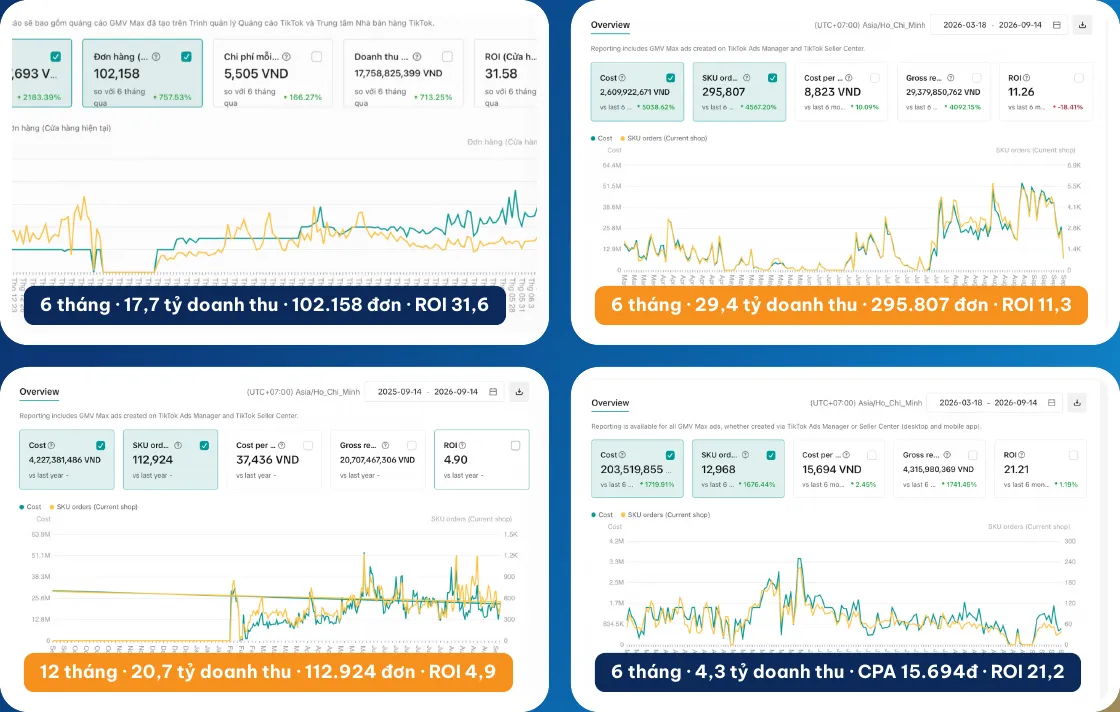
| 14/09/2025 – 14/09/2026 | 12 months | 4.23B | 20.71B | 112,924 | 4.90 |
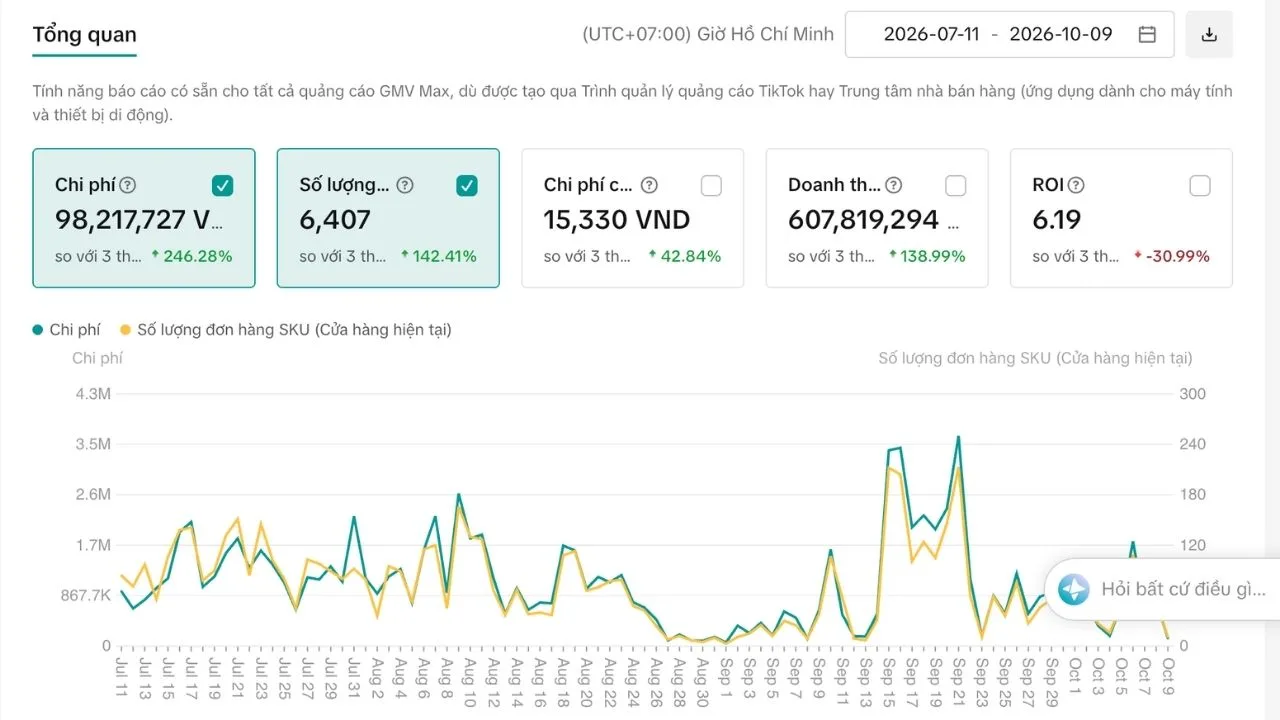
| Store with 246% budget increase (11/07 – 09/10/2026) | 3 months | 98.2M | 607.8M | 6,407 | 6.19 |
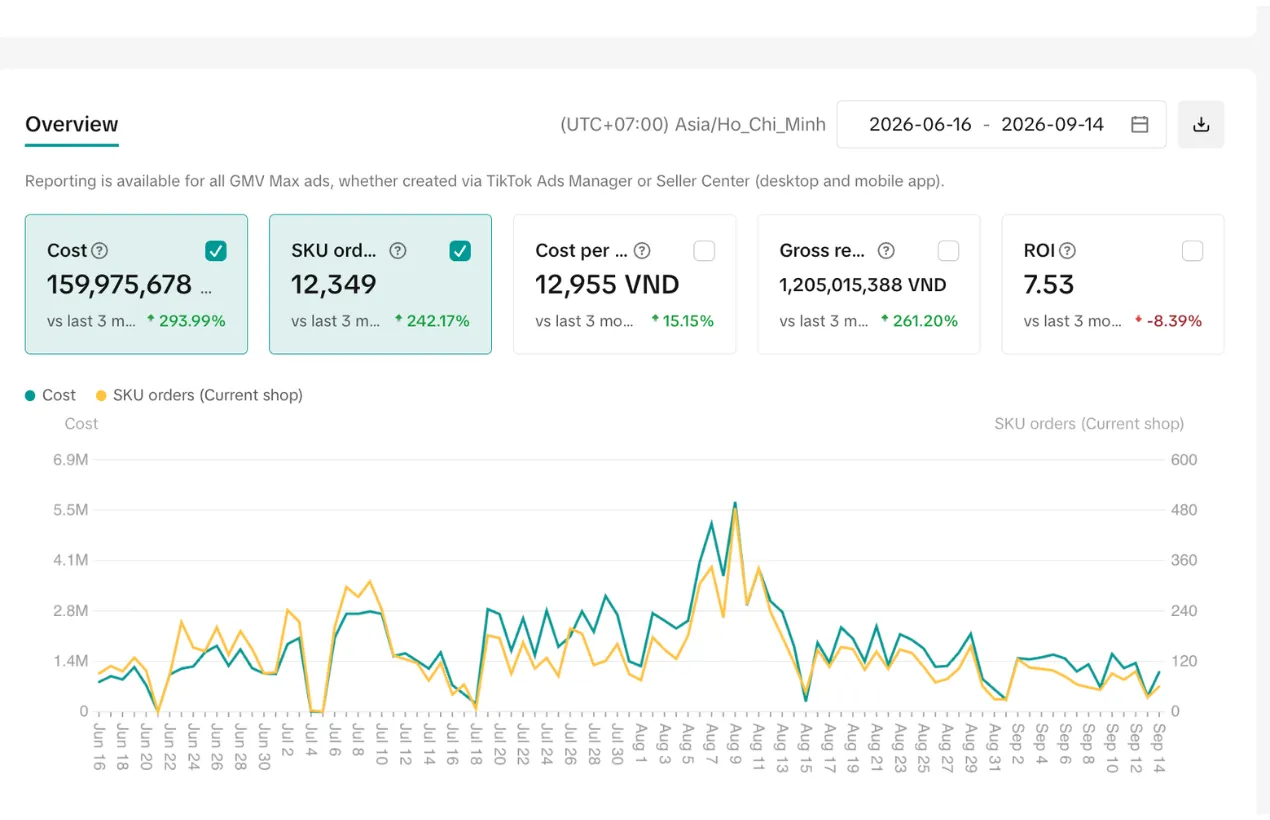
| 16/06 – 14/09/2026 | 3 months | 160M | 1.21B | 12,349 | 7.53 |
| Fashion store (02/10 – 09/10/2026) | 7 days | 34.7M | 266.7M | 1,958 | 7.69 |
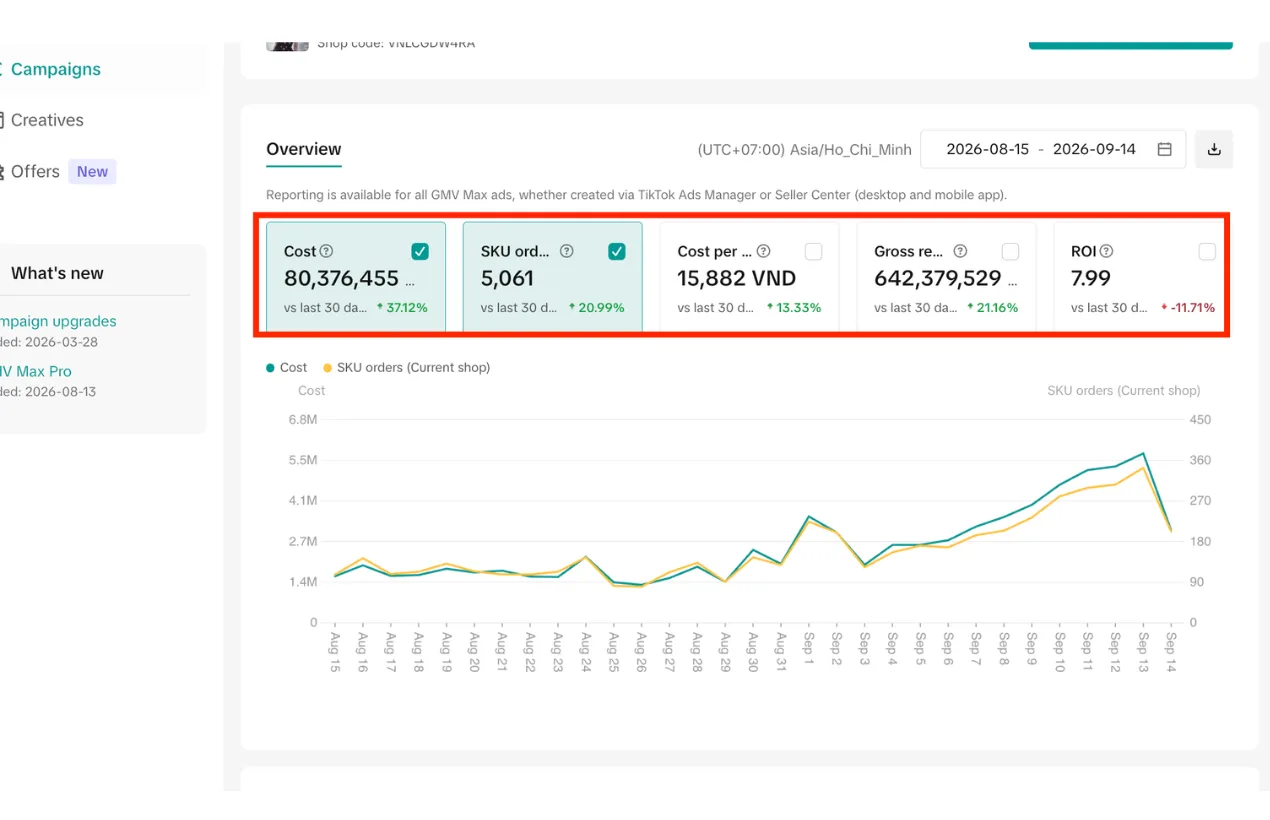
| 15/08 – 14/09/2026 | 30 days | 80.4M | 642.4M | 5,061 | 7.99 |
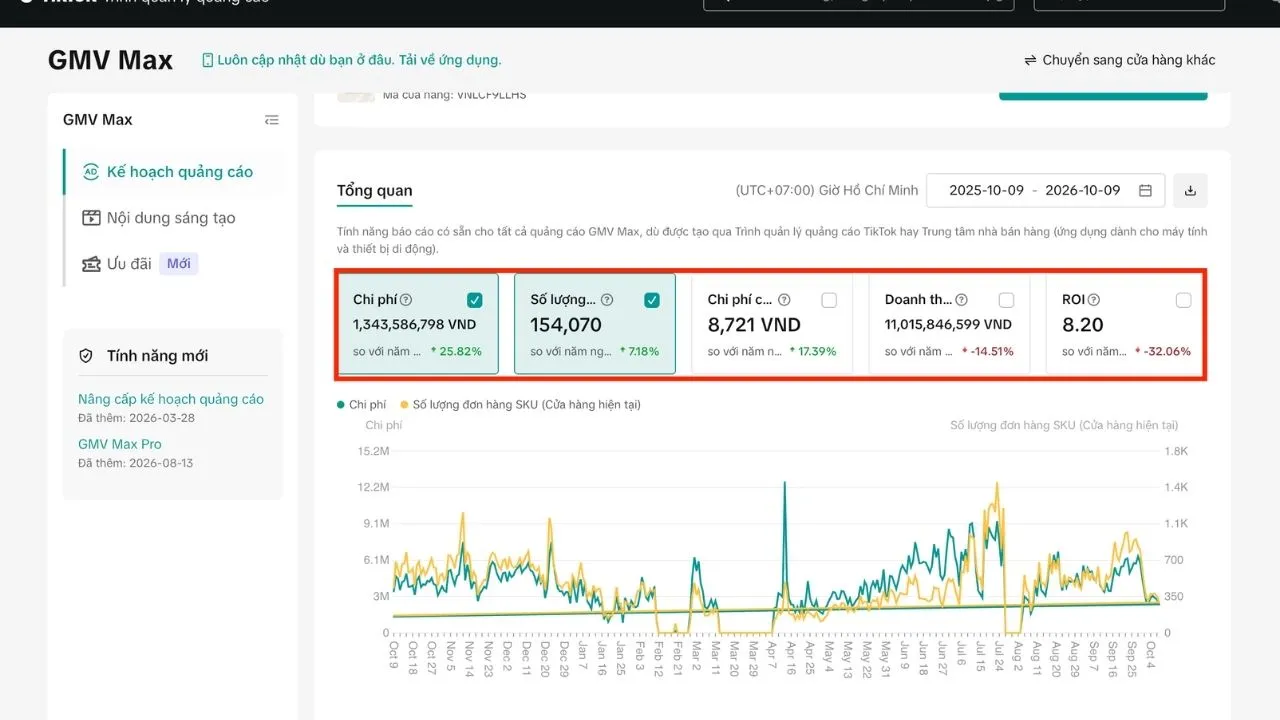
| Store 3, 12-month case | 12 months | 1.34B | 11.02B | 154,070 | 8.20 |
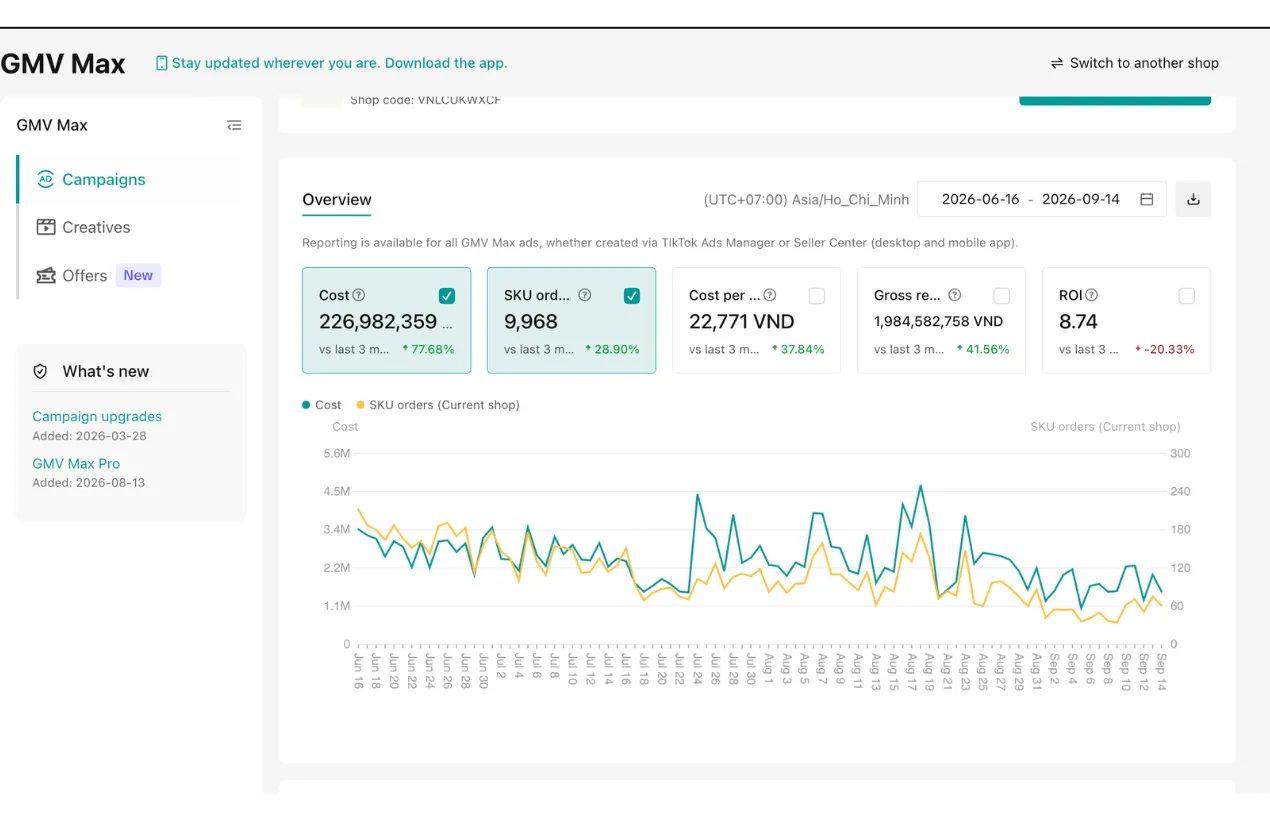
| 16/06 – 14/09/2026 | 3 months | 227M | 1.98B | 9,968 | 8.74 |
| Store 1, 12-month case | 12 months | 2.94B | 33.08B | 329,657 | 11.24 |
| 18/03 – 14/09/2026 | 6 months | 2.61B | 29.38B | 295,807 | 11.26 |
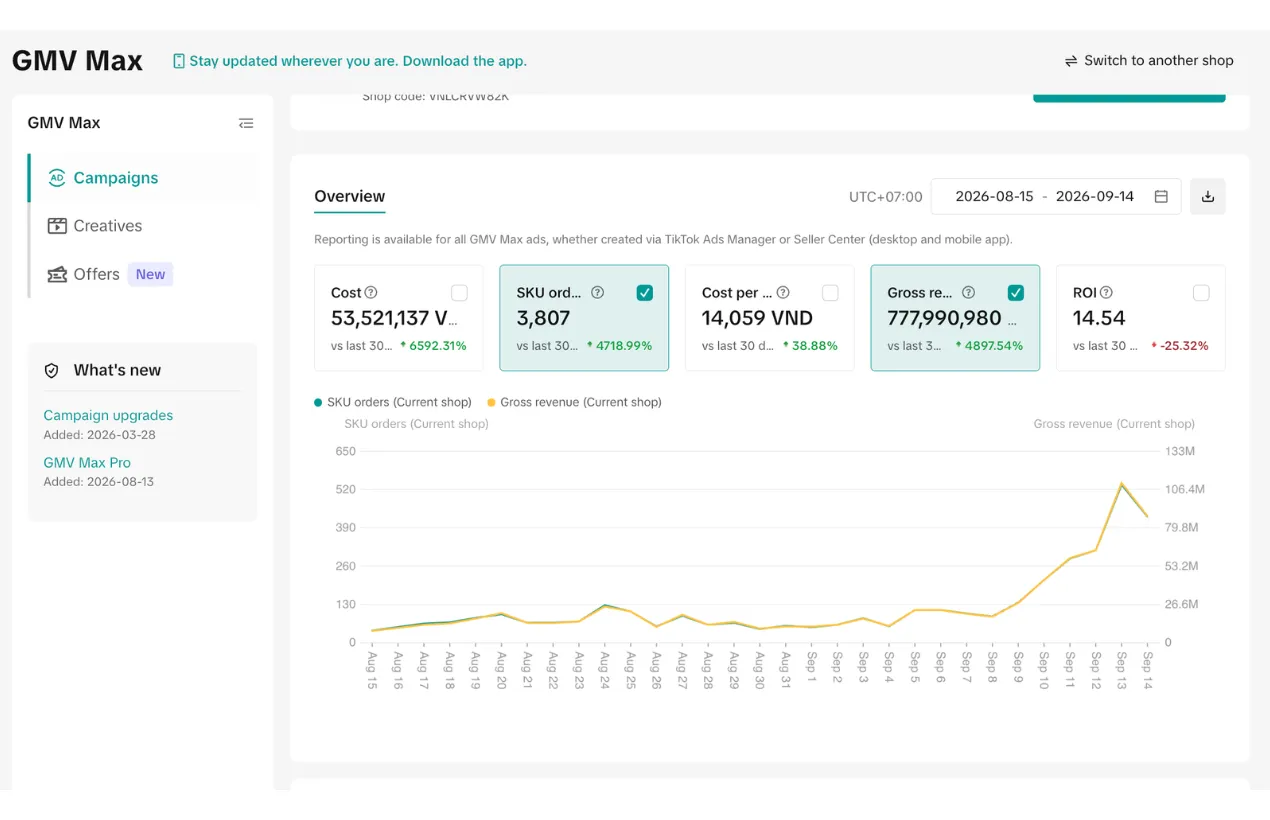
| 15/08 – 14/09/2026 | 30 days | ≈ 53.5M* | 778M | 3,807 | 14.54 |
| F-Basic Việt Nam (09/09 – 09/10/2026) | 30 days | 86.5M | 1.27B | 1,873 | 14.67 |
| 18/03 – 14/09/2026 | 6 months | 203.5M | 4.32B | 12,968 | 21.21 |
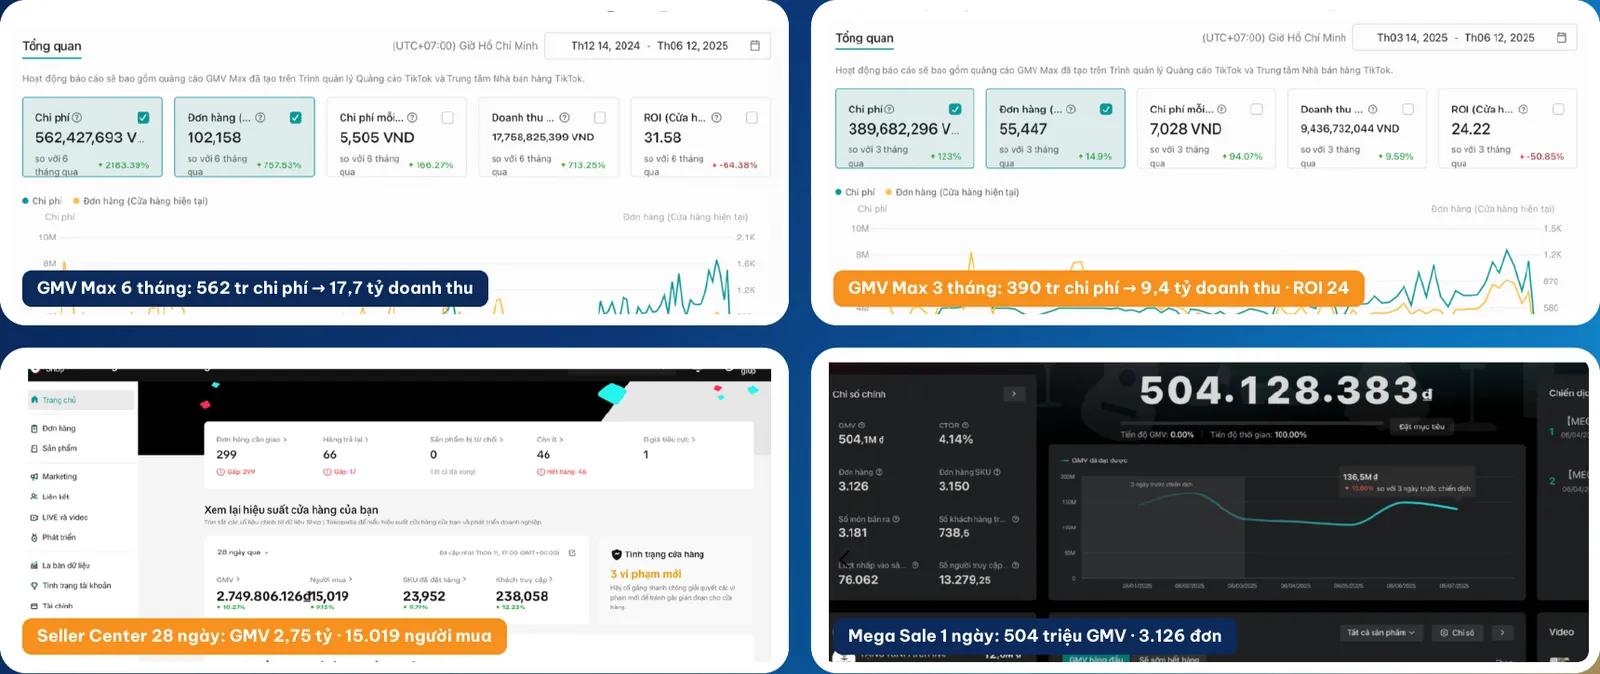
| 14/03 – 12/06/2025 (multi-category) | 3 months | 389.7M | 9.44B | 55,447 | 24.22 |
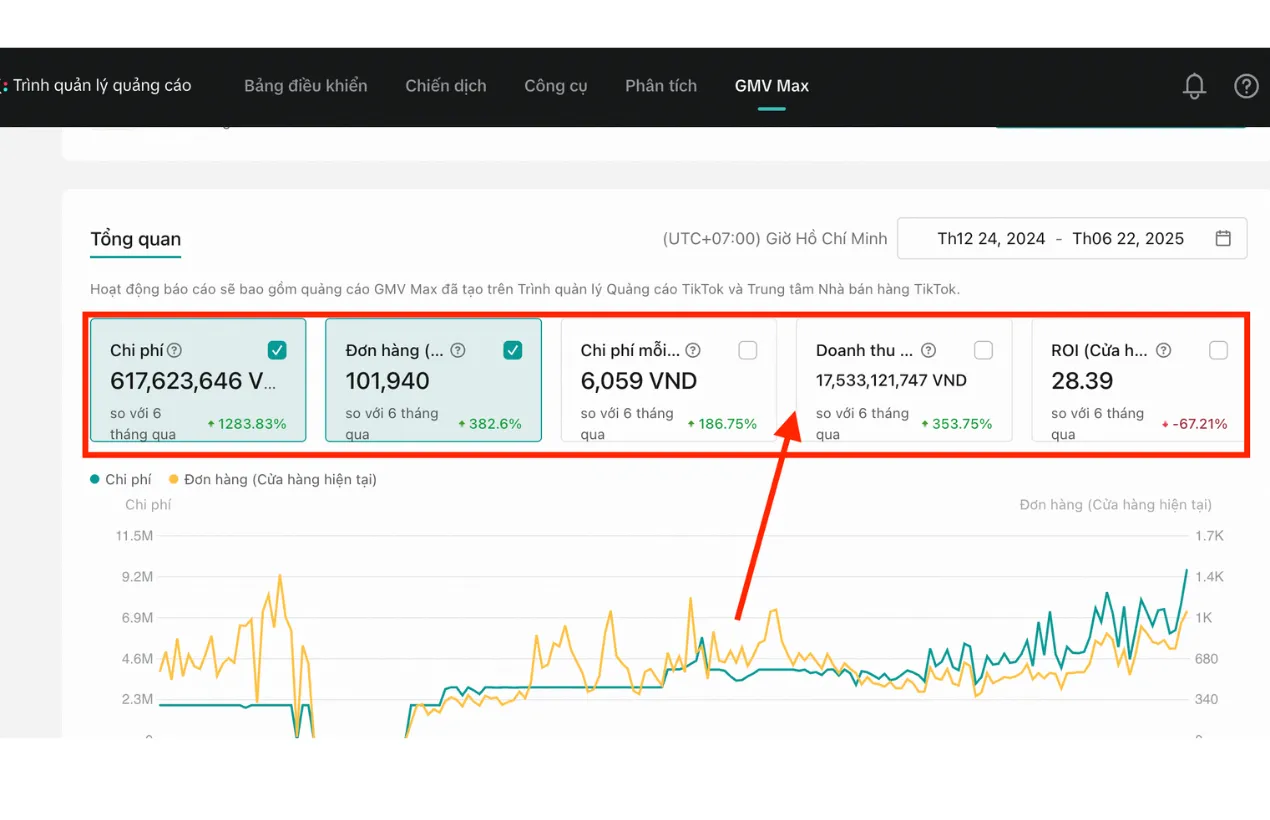
| 24/12/2024 – 22/06/2025 | 6 months | 617.6M | 17.53B | 101,940 | 28.39 |
| 18/03 – 14/09/2026 | 6 months | 58.9M | 1.69B | 4,801 | 28.64 |
| 14/12/2024 – 12/06/2025 (multi-category) | 6 months | 562.4M | 17.76B | 102,158 | 31.58 |
* Spend calculated as revenue ÷ ROI.
Orders are SKU orders (except the 28.39, 24.22 and 31.58 dashboards, which display the “Orders” metric). The 24.22 and 31.58 dashboards are the figures from the multi-category GMV Max case (the cover image of this article).
Reading the table quickly:
- 4 dashboards with ROI below 5. Three of them had spend of 2.76 billion VND or more. The other is a new store starting out.
- 6 dashboards with ROI 6 – 9. Mostly 7-day to 3-month windows with moderate spend.
- 4 dashboards with ROI 11 – 15. These include both large-spend dashboards (2.6 – 2.9 billion VND) and small-spend ones (under 90 million VND).
- 3 dashboards with ROI above 20. All are 6-month windows.
Growth strategy
From these 19 dashboards, LDH Media uses a common framework to choose an ROI target for each store.
Phase 1 – Foundation: know your threshold
- Calculate break-even ROI from the product’s gross margin (break-even ROI ≈ 1 ÷ margin before ads).
- Group products by price band, since different price bands produce different ROI.
- Fix the evaluation windows: weekly for adjustments, 3 – 6 months for conclusions.
Phase 2 – Activation: bring cost per order down
- Give the algorithm enough time to learn; don’t keep switching it on and off.
- Add new videos regularly for hero products.
- Optimise the product page and promotions to raise the close rate.
Phase 3 – Scale: choose total profit over the highest ROI
- Raise budget in steps and track marginal ROI (extra revenue ÷ extra spend).
- Accept a lower ROI when scaling, as long as marginal ROI stays above break-even.
- Concentrate budget on sale events and pull back when the market is slow.
Results
Two dashboards at opposite ends of the ROI range:
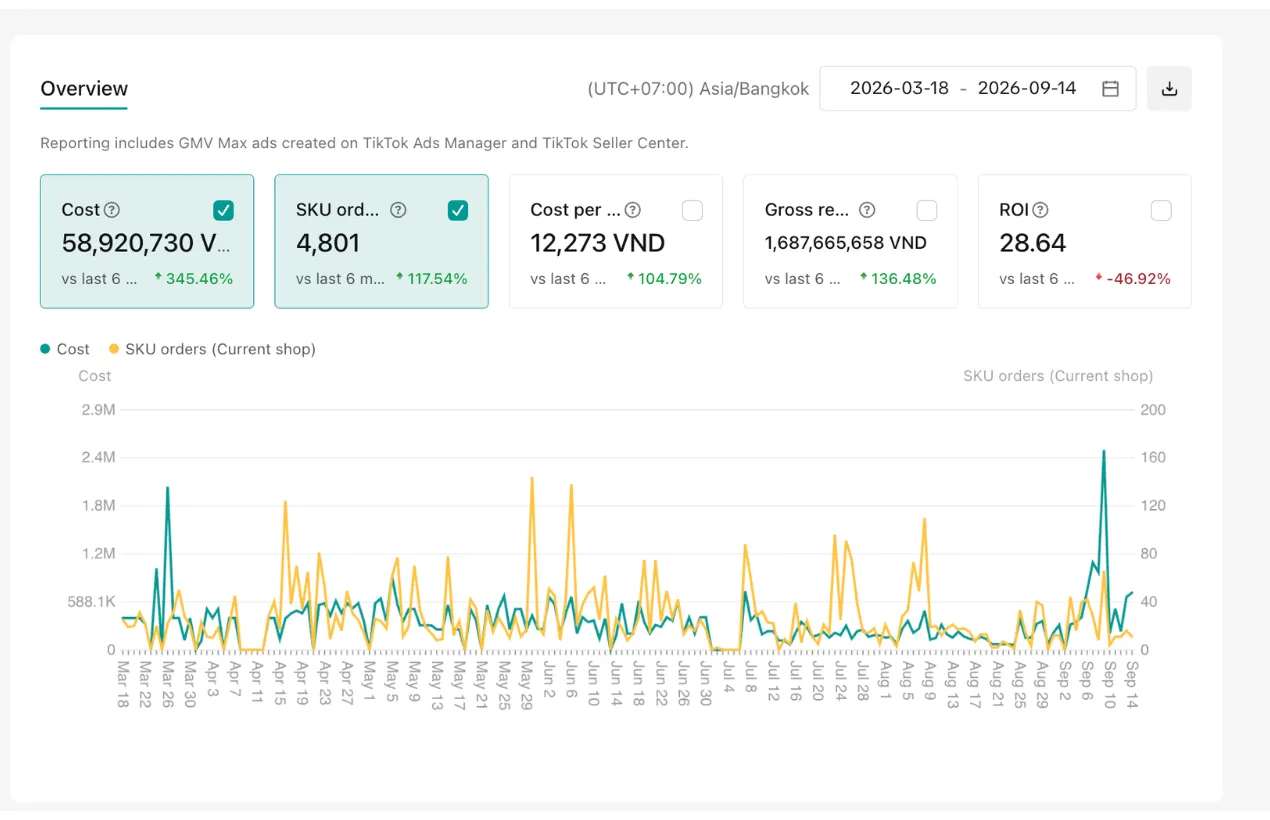
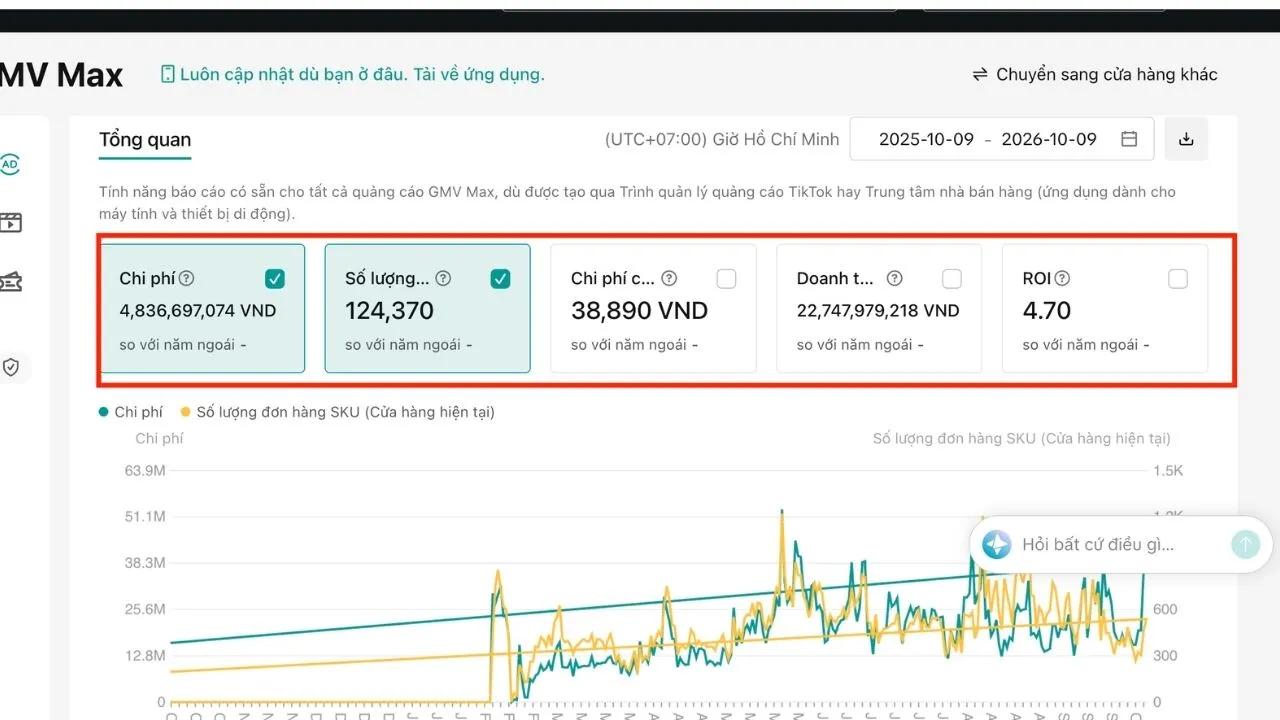
The ROI 28.64 dashboard spent less than 59 million VND over 6 months. The ROI 4.70 dashboard spent 4.84 billion VND over 12 months. Yet the low-ROI dashboard generated about 13.5 times more revenue. That is why ROI alone cannot be used to judge performance.
Analysis: where the growth came from
The underlying formula is very simple:
ROI = Revenue ÷ Spend = Average order value (AOV) ÷ Cost per order
Every difference in ROI comes down to these two metrics. The table below is calculated from the dashboard data (rounded):
| Dashboard | ROI | Cost per order | Order value |
|---|---|---|---|
| New store starting out | 4.54 | 33,504 VND | ≈ 152,200 VND |
| Store 2 – 12 months | 4.70 | ≈ 38,900 VND | ≈ 182,900 VND |
| Dế Mèn Vi Sinh | 4.72 | 19,207 VND | ≈ 90,700 VND |
| Store 3 – 12 months | 8.20 | ≈ 8,700 VND | ≈ 71,500 VND |
| Store 1 – 12 months | 11.24 | ≈ 8,900 VND | ≈ 100,400 VND |
| F-Basic Việt Nam | 14.67 | 46,197 VND | ≈ 677,800 VND |
| 6 months, ROI 21.21 | 21.21 | ≈ 15,700 VND | ≈ 333,100 VND |
| 6 months, ROI 28.39 | 28.39 | 6,059 VND | ≈ 172,000 VND |
| 6 months, ROI 28.64 | 28.64 | ≈ 12,300 VND | ≈ 352,000 VND |
From this, there are 5 main reasons ROI differs.
1. Price and order value. F-Basic has a cost per order of 46,197 VND, the highest in the table, yet ROI is still 14.67 because each order is worth about 677,800 VND. Conversely, Dế Mèn Vi Sinh has a cost per order of only 19,207 VND but an order value of about 90,700 VND, so ROI is 4.72. Low-priced products can almost never reach ROI 20 – 30.
2. Category margin. A low ROI is not necessarily a loss. An illustrative example: a product with a 50% gross margin breaks even at an ROI of only about 2. A product with a 20% margin needs an ROI of about 5 to break even. So ROI 4.7 can be a healthy profit in one category and a loss in another.
3. Scaling stage. The ROI 28.39 dashboard was down 67.21% from the previous 6 months, after spend rose 1,283.83%. The store that raised its budget 246% also saw ROI fall 30.99%. When scaling, the algorithm has to find more buyers who are harder to convert, so average ROI goes down.
4. Spend level. The five dashboards spending 2.6 billion VND or more all have ROI in the 4.70 – 11.26 range. The three dashboards with ROI above 20 spent between 58.9 million and 617.6 million VND. With small spend, the algorithm serves only the “easiest to buy” customers. With large spend, it has to expand to harder groups.
5. Measurement window length. A 7-day or 30-day window is easily skewed by one sale event or one viral video. A 12-month window includes off-peak months and the ramp-up phase, so ROI is usually lower. For example, the ROI 28.39 dashboard had a final week with ROI of only 19.23.
Limits of this data set: GMV Max dashboards have no visitor count, so the conversion rate cannot be separated out; the article compares ROI only, not profit, because cost of goods is missing; and time windows are not uniform, so comparing 7 days with 12 months is for reference only.
Lessons for store owners
- Don’t compare your ROI with other stores. Compare it with your own product’s break-even ROI.
- If you want a higher ROI, look at order value first. Bundles, product sets and free gifts lift AOV faster than squeezing cost per order.
- ROI falling while scaling is normal. The right target is total profit, not the highest ROI.
- Evaluate across multiple time windows. Weekly to adjust, 3 – 6 months to conclude.
- Track cost per order daily. It is the earliest warning sign that ads are starting to weaken.
Actual results depend on product, price, inventory, budget and platform policies. This is not a commitment to results for every client.
Is this your situation?
- You hear others boasting ROI of 20 or 30, while your store keeps hovering around 5, and you don't know what you're doing wrong.
- You don't know what ROI is profitable and what ROI is a loss for your product.
- Every time budget goes up ROI drops, so you're torn between protecting ROI and growing revenue.
- The 7-day report looks great, the full month looks different, and you don't know which window to trust.
LDH Media audits your store or ad account for free and points out the 3 things to fix first — based on real data, not sales promises.
Project images & data