TikTok Shop operations5 min read
Background & challenge
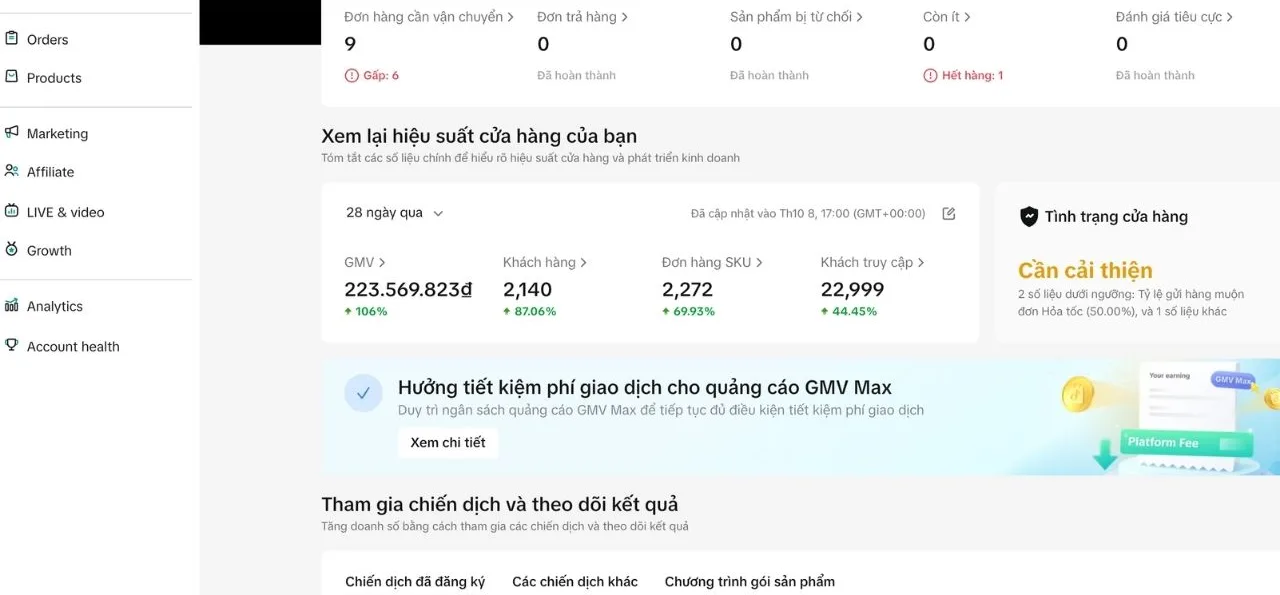
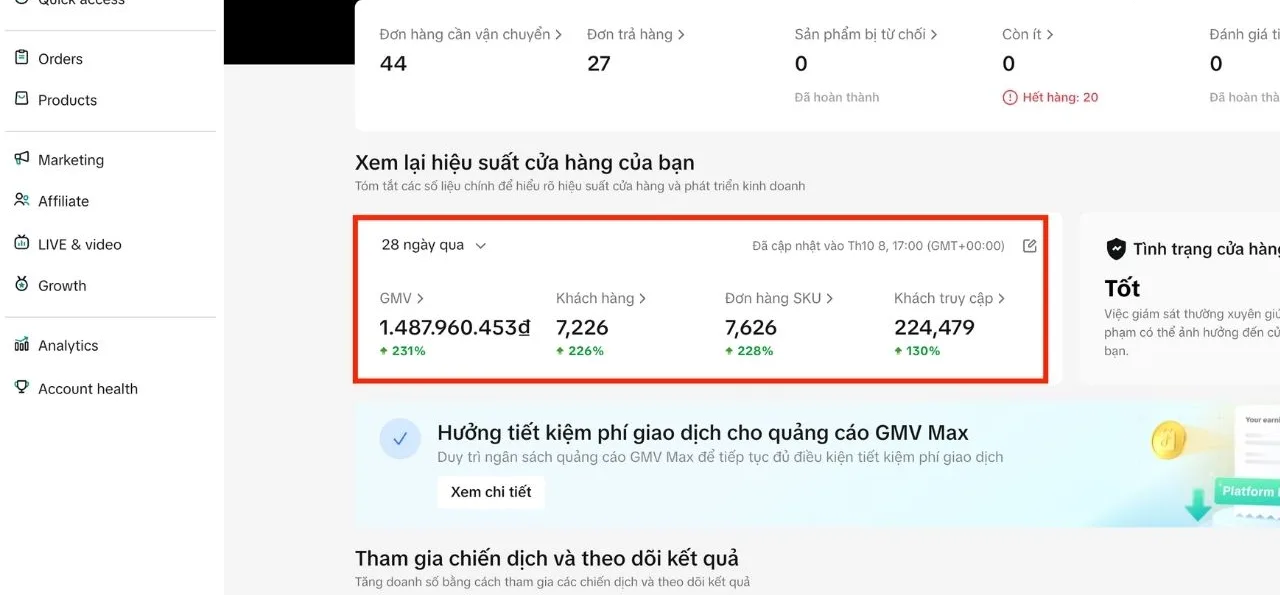
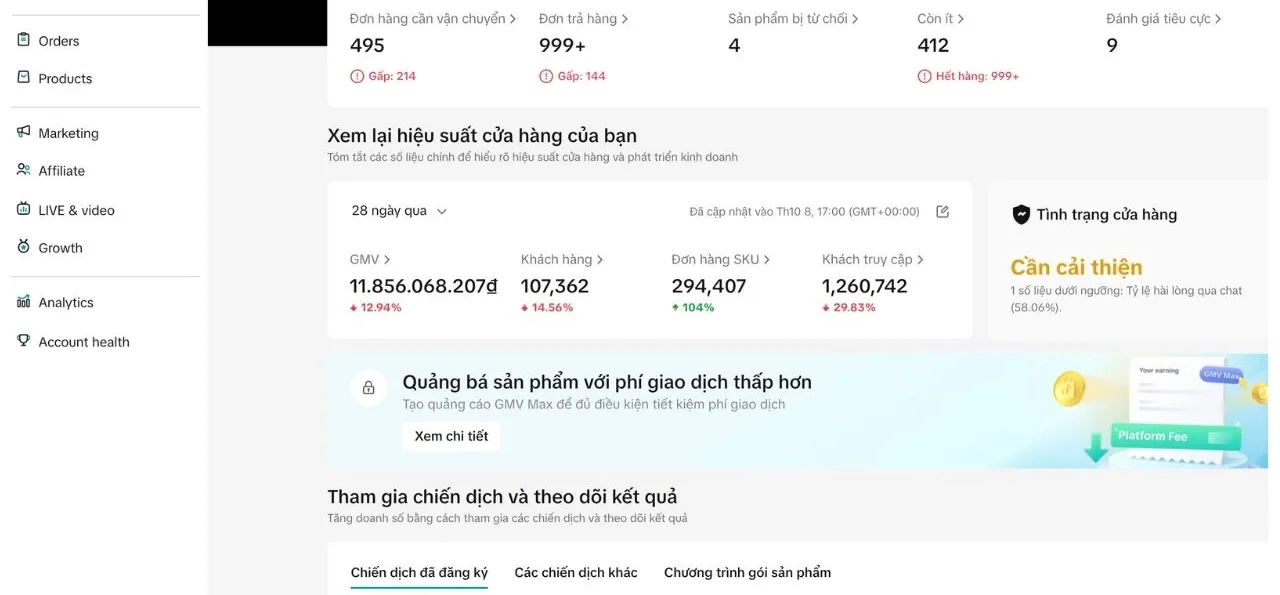
This article brings together 3 Seller Center dashboards from TikTok Shop stores that LDH Media manages end to end. The scope covers products, content, affiliates, ads and order care. Store names are hidden under a confidentiality agreement.
The three stores are at three different scales, but their owners share the same challenge:
- Grow revenue without “breaking” operations. As orders rise, warehousing, shipping and customer care have to keep up.
- Know where growth comes from. Is revenue rising because of new customers, customers buying more, or just a few peak days?
- Keep store health stable. This metric directly affects eligibility for campaigns and how the platform distributes the store.
The shared goal is steady month-over-month growth, with data clear enough for the owner to make decisions.
Diagnosis from the data
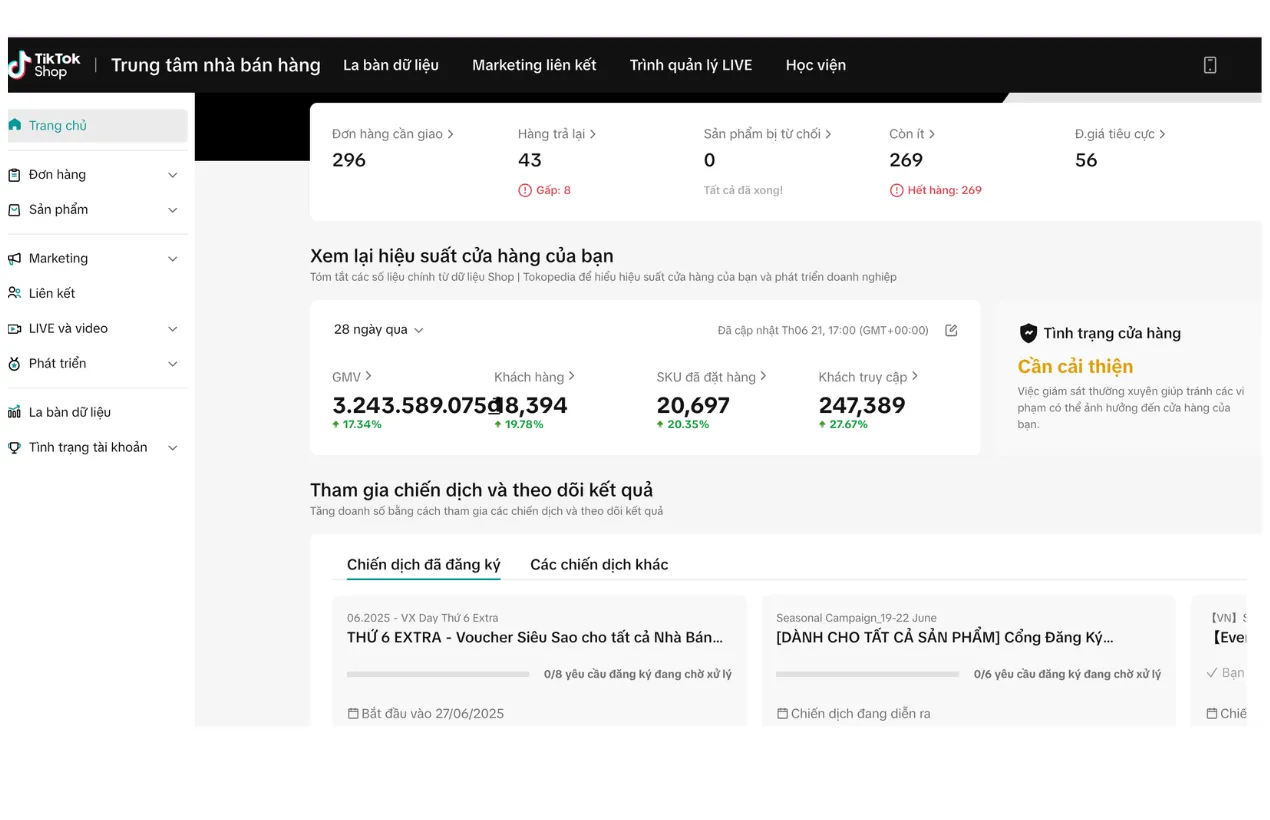
Store A – 28 days to 21/06/2025. The home dashboard shows all four key metrics rising:
- GMV 3,243,589,075 VND (+17.34%), customers 18,394 (+19.78%), SKUs ordered 20,697 (+20.35%), visitors 247,389 (+27.67%).
- Conversion rate about 7.4% (18,394 customers ÷ 247,389 visitors, calculated from dashboard data).
- Average GMV per customer about 176,000 VND. Each customer ordered about 1.13 SKUs (calculated from the dashboard).
The good news is that growth came from real customer volume. But the same dashboard shows very clear “bottlenecks”:
- Store health: “Needs improvement”.
- 269 products out of stock, 296 orders waiting to ship, 43 returned orders (8 urgent), 56 negative reviews.
This is the typical profile of a fast-growing store: it can sell, but hasn’t yet caught up on keeping customers.
Store B – April 2025. GMV 7.17 billion VND (+29.44%), 68,312 units sold (+34.11%), 66,963 SKU orders (+35.01%). Average GMV per SKU order about 107,000 VND (calculated from the dashboard). Units and orders grew faster than GMV. That means order value dipped slightly and growth came from volume.
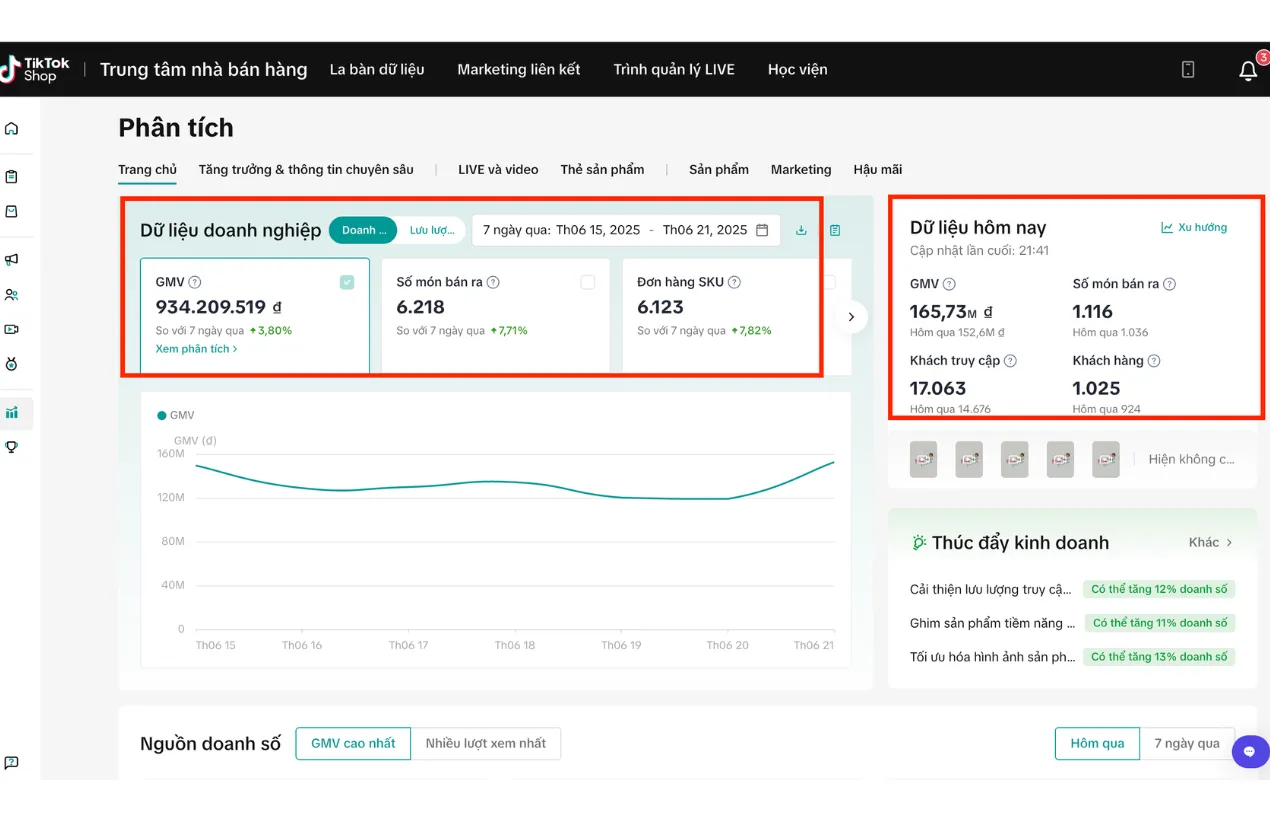
Store C – 7 days (15/06 – 21/06/2025). GMV 934,209,519 VND (+3.80%), 6,218 units (+7.71%), 6,123 SKU orders (+7.82%). On average about 133.5 million VND GMV per day and about 153,000 VND per SKU order (calculated from the dashboard). The 7-day chart is fairly flat with no spike days, a sign of stable revenue.
Growth strategy
LDH Media’s operating framework for consumer goods and fashion stores that sell through video and affiliates:
Phase 1 – Foundation
- Review the catalog: pricing, inventory, variants, images and product titles.
- Set up a weekly store-health check: late shipments, returns, negative reviews.
- Pick a core product group to focus content and budget on.
Phase 2 – Activation
- Produce in-house short videos across tracks: try-outs, comparisons, reviews, promotions.
- Open affiliates and book KOCs by category to add more product-tagged video sources.
- Register for platform campaigns on schedule (double-date sales, seasonal events).
Phase 3 – Scale
- Use in-house and KOC videos that already drive orders as GMV Max creatives.
- Track cost per order daily and raise budget in steps.
- Forecast inventory based on sales velocity to avoid stock-outs in the middle of a growth push.
Results
| Store | Metric | Result | vs. previous period |
|---|---|---|---|
| A (28 days) | GMV | 3,243,589,075 VND | +17.34% |
| A (28 days) | Customers | 18,394 | +19.78% |
| A (28 days) | SKUs ordered | 20,697 | +20.35% |
| A (28 days) | Visitors | 247,389 | +27.67% |
| B (April 2025) | GMV | 7.17 billion VND | +29.44% |
| B (April 2025) | Units sold | 68,312 | +34.11% |
| B (April 2025) | SKU orders | 66,963 | +35.01% |
| C (7 days) | GMV | 934,209,519 VND | +3.80% |
| C (7 days) | Units sold | 6,218 | +7.71% |
| C (7 days) | GMV for the day (“Today’s data” section) | 165.73 million VND | — |
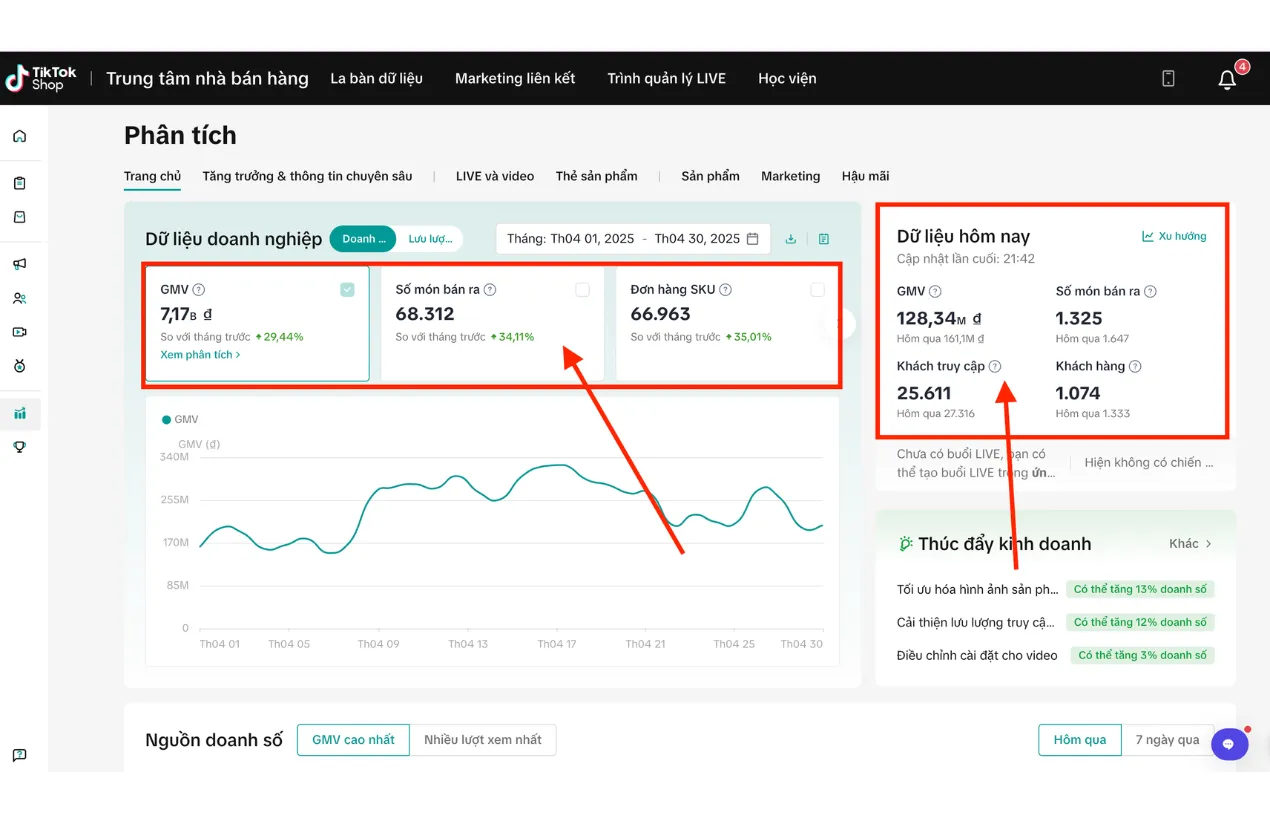
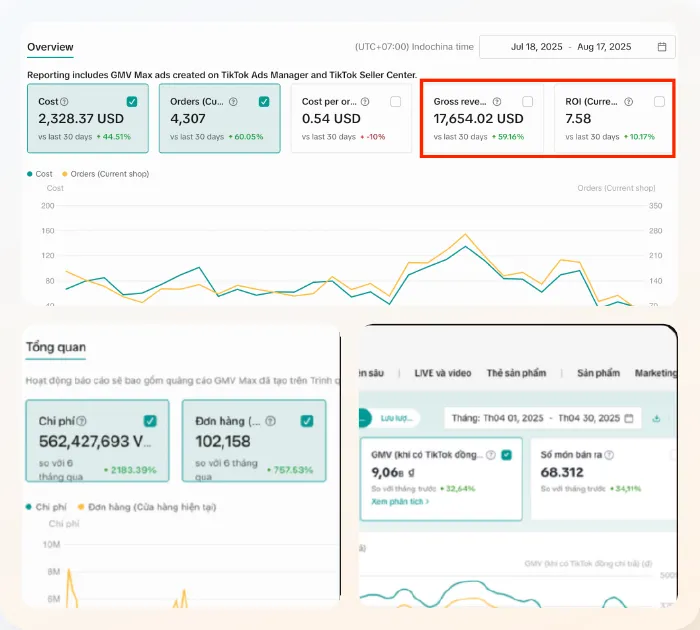
For Store B, the “GMV with TikTok co-funding” view for the same month of April 2025 shows 9.06 billion VND (+32.64%). This article uses the 7.17 billion VND figure (standard GMV) for consistent comparison.
Analysis: where the growth came from
Take Store A as an example. GMV can be split into: visitors × conversion rate × GMV per customer.
| Component | Previous period (estimate) | This period | Change |
|---|---|---|---|
| Visitors | about 193,800 | 247,389 | +27.67% |
| Conversion rate | about 7.9% | about 7.4% | Slight decrease |
| GMV per customer | about 180,000 VND | about 176,000 VND | Slight decrease |
Previous-period figures are back-calculated from the growth percentages on the dashboard and are estimates only.
Conclusion: traffic is the main driver. Videos and affiliates brought many more people into the store. But conversion rate and value per customer both dipped slightly. This often happens when new traffic is broader and less well-targeted than existing customers.
The weak spots and how to fix them:
- 269 products out of stock. Customers visit but can’t buy. This may be one reason conversion fell. Fix: hide or merge out-of-stock SKUs, and restock top-selling SKUs based on sales velocity.
- 56 negative reviews and 43 returns. Classify them by cause: product, packaging or shipping. Then fix the right step.
- “Needs improvement” status. Prioritize late shipments and urgent orders first, as this group affects the store score fastest.
Stores B and C show the same trend: units and orders grow faster than GMV. The stores are selling more, but each order is slightly smaller. To lift order value, use bundles, free gifts above a spending threshold, or cross-sell suggestions.
Lessons for store owners
- Always read 4 metrics together: GMV, customers, orders/SKUs and visitors. A single metric can’t tell you where growth comes from.
- Calculate conversion rate every week. When traffic rises but conversion falls, it’s time to review products, pricing and inventory.
- Store health is a daily job. Don’t wait for a red warning before dealing with late orders and returns.
- Don’t run out of stock mid-growth. A stock-out costs both orders and product ranking.
- Read multiple time frames: 7 days to react quickly, 28 days and monthly to see the trend.
Actual results depend on the product, pricing, inventory, budget and platform policies. This is not a guarantee of results for every client.
Is this your situation?
- Revenue is going up, but I can't tell whether it's from new customers or just a few lucky days.
- When the store sells a lot, products run out of stock, shipping gets slow and bad reviews start to appear.
- Store health shows "Needs improvement" and I don't know where to start fixing it.
- Handling content, ads and packing alone leaves no time to read the data.
LDH Media audits your store or ad account for free and points out the 3 things to fix first — based on real data, not sales promises.
Project images & data
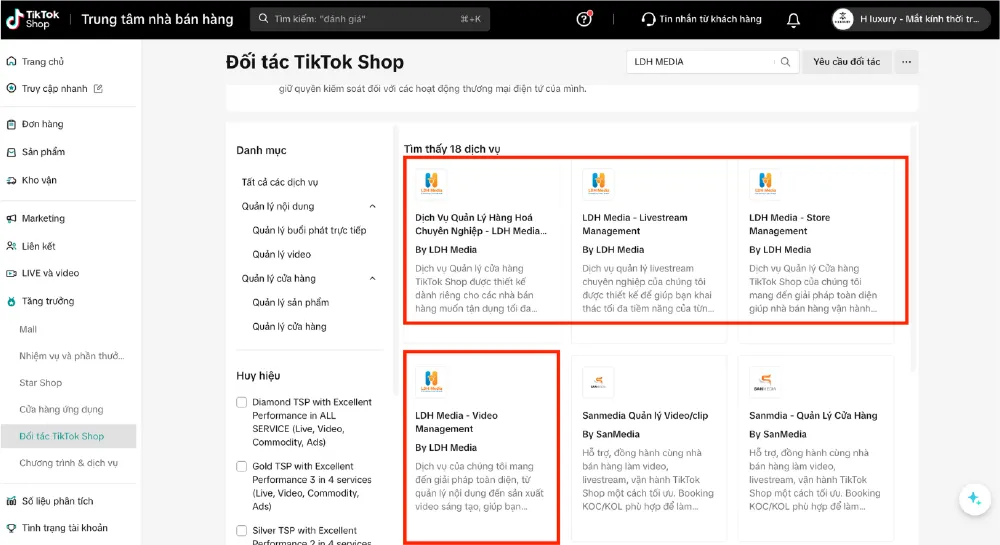


Services delivered