TikTok Shop operations4 min read
Background & challenge
This is a TikTok Shop store moving from a few hundred million VND to the billion mark every 28 days. The brand name and category are withheld by agreement.
Back-calculating from the dashboard, 28 days earlier the store did about 450 million VND in GMV. It already had a base and products that sell. But to triple its scale, the old way of working was not enough.
Store owners’ worries at this leap:
- Increasing ad spend risks the purchase rate not keeping up.
- Fast-growing orders risk late shipping, bad reviews and the platform lowering the store’s score.
- One person cannot simultaneously create content, run ads, manage KOCs and process orders.
Goal: grow strongly but under control — revenue up while store health stays at Good.
Diagnosis from the data
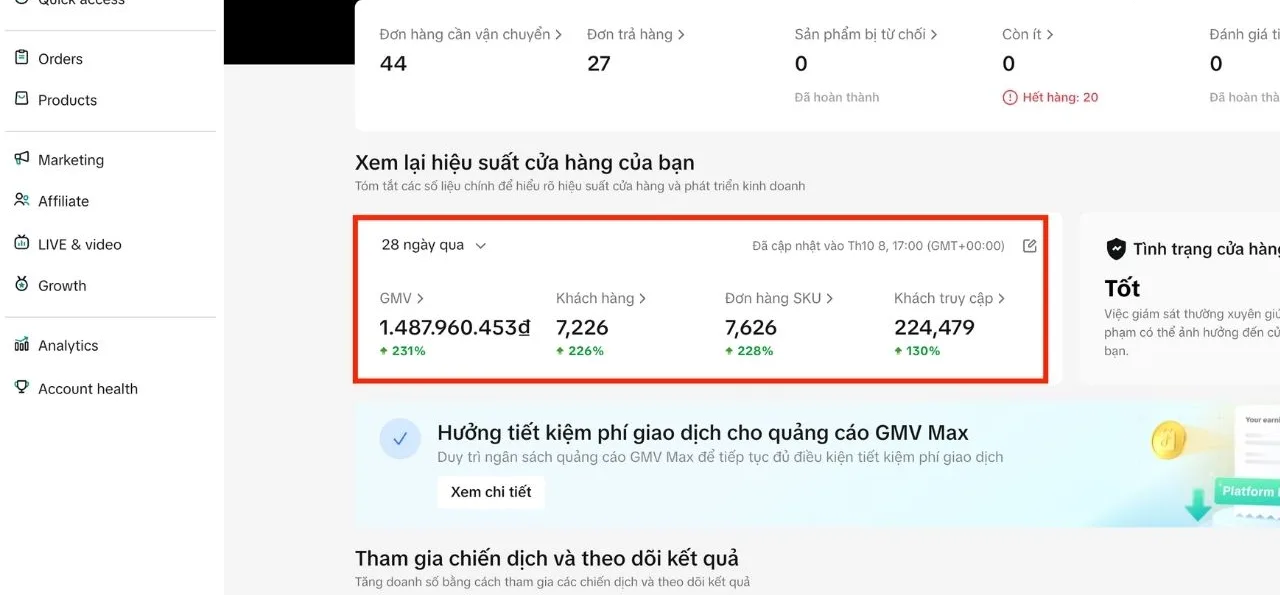
“Last 28 days” dashboard (updated Oct 8, 2026): GMV 1,487,960,453 VND (+231%), customers 7,226 (+226%), SKU orders 7,626 (+228%), visitors 224,479 (+130%). Store health: Good.
Metrics calculated from the dashboard data (the previous period is back-calculated from the %, so these are estimates):
- Previous-period GMV: about 449.5 million VND. The increase is about 1.04 billion VND.
- Conversion rate: about 3.22%. Previous period about 2.27%.
- GMV per customer: about 205,900 VND. Previous period about 202,800 VND.
- GMV per SKU order: about 195,100 VND.
- SKU orders per customer: about 1.06.
Worth noting: GMV (+231%), customers (+226%) and SKU orders (+228%) grew at almost the same pace. This means value per customer held steady — the store did not have to discount to drive orders, nor did it depend on a few unusually large orders.
Customers grew faster than visitors (+226% vs. +130%). That is, conversion rate rose sharply, by about 42%.
The dashboard shows no metrics below threshold in the store health tile.
Growth strategy
The framework LDH Media applies to “from a few hundred million to the billion mark” stores. No client-specific details are disclosed.
Phase 1 — A foundation that can handle the load
- Forecast orders by week and prepare matching inventory and packing supplies.
- Standardize order processing and carrier handover with fixed time slots.
- Review core product pages: images, prices, vouchers, reviews.
- Set up weekly Account Health monitoring.
Phase 2 — Activate multiple sources
- Produce videos regularly in the formats that already drive orders.
- Book KOCs in tiers: many small KOCs for content coverage, a few larger KOCs for push periods.
- Run GMV Max steadily, increasing budget in steps while cost per order stays within threshold.
Phase 3 — Scale and maintain quality
- Concentrate resources on high-converting products and videos.
- Livestream during time slots with the most buyers.
- Track growth and operational metrics side by side — when any metric hits its threshold, slow down to fix it.
Results
| Metric | Result | vs. previous 28 days |
|---|---|---|
| GMV | 1,487,960,453 VND | +231% |
| Customers | 7,226 | +226% |
| SKU orders | 7,626 | +228% |
| Visitors | 224,479 | +130% |
| Conversion rate (calculated from dashboard) | about 3.22% | about +42% |
| Store health | Good | — |
The original Seller Center dashboard screenshot is at the top of the article.
GMV is about 3.3x the previous period, and this growth is on a base of nearly half a billion VND — not from a very small number.
Analysis: where the growth came from
Breaking GMV into visitors × conversion rate × GMV per customer, calculated from the dashboard data:
- Visitors: +130% (2.3x).
- Conversion rate: about +42%.
- GMV per customer: about +1.5%.
Multiplied together: 2.30 × 1.42 × 1.015 ≈ 3.31, consistent with the +231% GMV.
This is balanced growth:
- Traffic up 2.3x — customer sources expanded.
- Conversion up about 42% — viewers are better targeted, and product pages and content are more convincing. Usually when traffic grows strongly, conversion tends to fall. Here, conversion rose.
- Value per customer almost unchanged — growth did not come from discounting.
Points to watch:
- Conversion of about 3.22% is much better than the previous period, but there is still room. Optimizing the most-viewed product pages is the next step.
- SKU orders per customer of about 1.06 — most customers buy 1 item. Bundles or free gifts could raise order value.
- Keeping health at Good as orders keep growing. Orders have more than tripled, so shipping metrics will be under greater pressure next period. They need close monitoring rather than waiting until the status turns “Needs improvement”.
Lessons for store owners
- Healthy scaling is when traffic, conversion and order value do not drag each other down. Check all three after every period.
- Prepare operations before pushing ads. More than tripling orders while staying at Good is only possible when order fulfillment keeps up.
- Multiple traffic sources: video, KOCs, ads, livestream. Do not put everything into one channel.
- Increase budget in steps, and measure cost per order after each increase.
- Read the % together with the absolute figure: +231% on a base of about 450 million VND is an increase of about 1.04 billion VND.
Actual results depend on the product, price, inventory, budget and platform policies. This is not a commitment to results for every client.
Is this your situation?
- The store sells a few hundred million VND a month and wants to reach the billion mark, but does not know where to start.
- We once had a surge in orders, then late deliveries and bad reviews, and revenue fell back.
- We want to run ads more aggressively but fear burning money without the purchase rate rising.
- One person juggling content, ads, KOCs and orders means everything gets done halfway.
LDH Media audits your store or ad account for free and points out the 3 things to fix first — based on real data, not sales promises.
Project images & data