TikTok Shop operations5 min read
Background & challenge
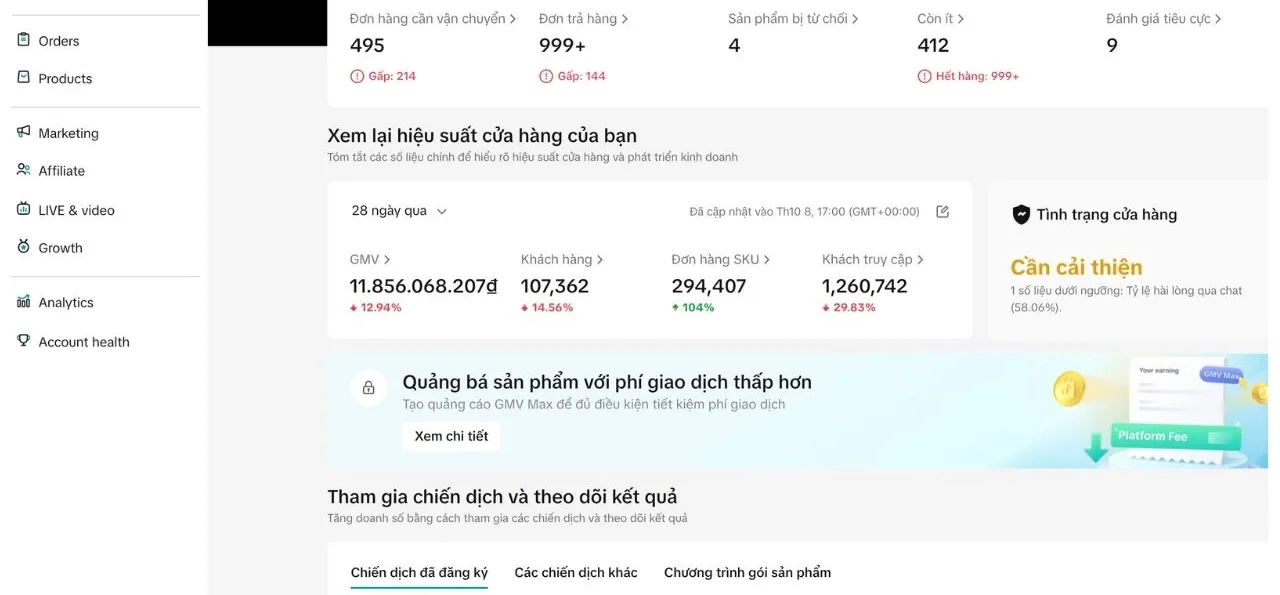
This is a large-scale TikTok Shop store: more than 11 billion VND in GMV every 28 days and more than 100,000 customers. The brand name and category are withheld by agreement.
At this scale, every swing of a few percent means hundreds of millions to billions of VND. And there is a very common trap: looking at one time frame and drawing conclusions.
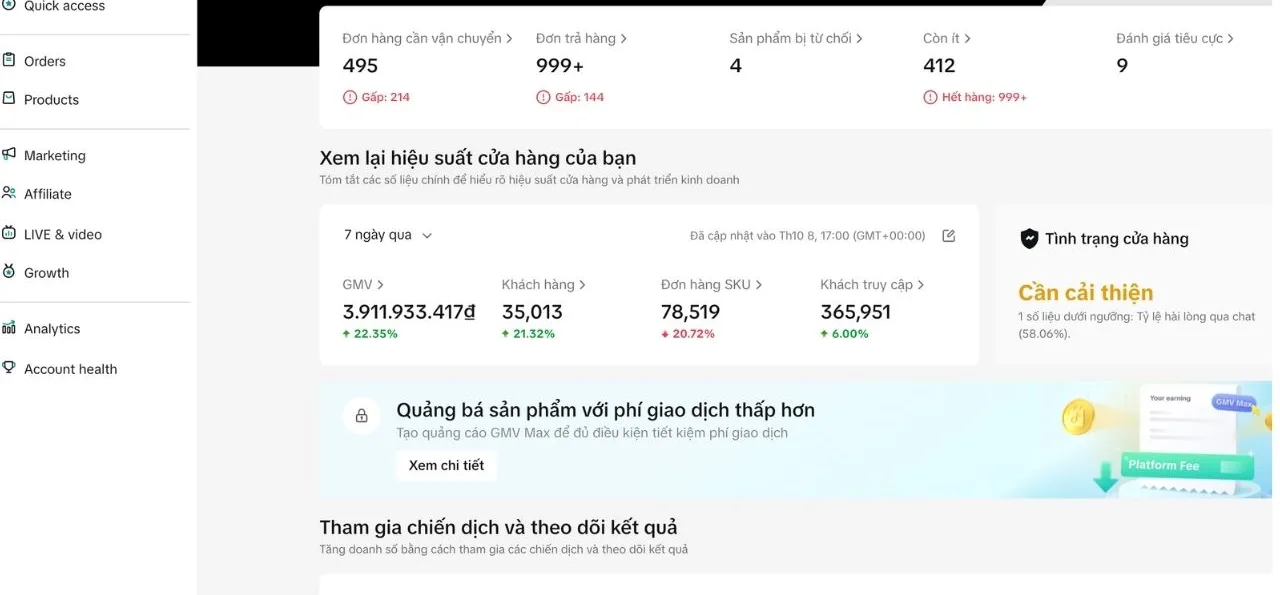
The 28-day dashboard shows GMV down 12.94%. Looking only at that, the obvious reactions are: deeper discounts, rushing more ad spend, changing strategy. But switch to the “Last 7 days” view and the picture is completely different: GMV up 22.35%.
The challenge in this case is reading the trend correctly before acting, and fixing one specific operational weakness: customer care via chat.
Diagnosis from the data
Two dashboards for the same store, both updated Oct 8, 2026:
| Metric | Last 28 days | vs. previous 28 days | Last 7 days | vs. previous 7 days |
|---|---|---|---|---|
| GMV | 11,856,068,207 VND | −12.94% | 3,911,933,417 VND | +22.35% |
| Customers | 107,362 | −14.56% | 35,013 | +21.32% |
| SKU orders | 294,407 | +104% | 78,519 | −20.72% |
| Visitors | 1,260,742 | −29.83% | 365,951 | +6.00% |
Metrics calculated from the dashboard data (the previous period is back-calculated from the %, so these are estimates):
- Average daily GMV: about 423 million VND/day over 28 days; about 559 million VND/day over the latest 7 days — roughly 32% higher.
- The latest 7 days account for about 33% of the 28-day GMV, despite being only 25% of the time.
- Previous 28-day GMV: about 13.62 billion VND. The decline is about 1.76 billion VND.
- 28-day conversion rate: about 8.52% (previous period about 6.99%). 7-day: about 9.57% (previous 7 days about 8.36%).
- GMV per customer: about 110,400 VND over 28 days; about 111,700 VND over 7 days — almost stable.
- SKU orders per customer: about 2.74 over 28 days (previous period about 1.15); about 2.24 over 7 days (previous 7 days about 3.43).
Quick read:
- 28-day traffic fell nearly 30%, the main reason the 28-day GMV declined. The previous period was most likely a peak period.
- Conversion rose in both time frames. Fewer visitors, but of “higher quality”.
- The latest week has recovered: GMV, customers and traffic all rose.
The “bottleneck”: store health is Needs improvement, with 1 metric below threshold — chat satisfaction rate of 58.06%.
Growth strategy
The framework LDH Media applies to large-scale stores after a peak period. No client-specific details are disclosed.
Phase 1 — Read correctly before acting
- Track 3 time frames side by side: 7 days, 28 days, and the same period of the previous campaign.
- Split GMV by source (video, LIVE, product cards, affiliate) to see which source declined.
- Investigate why SKU orders and customers move in opposite directions — check bundle and gift configuration and how products are counted as SKUs.
- Do not make major strategy changes just because one 28-day frame is down.
Phase 2 — Fix the customer care weakness
- Template replies for recurring questions: order status, returns, sizing, how to use.
- Schedule chat shifts around the hours when customers message most.
- Prioritize messages about orders in transit or complaints.
- Re-measure chat satisfaction every week.
Phase 3 — Sustain the recovery
- Concentrate GMV Max budget on product groups that are growing in the latest 7 days.
- Keep a steady content and KOC schedule so traffic does not depend on peak periods.
- Prepare inventory and staffing for the major year-end campaigns.
Results
The 28-day and 7-day table above shows the current results. The 28-day dashboard screenshot is at the top of the article; below is the 7-day dashboard for the same store:
| View | Conclusion |
|---|---|
| 28 days | Down 12.94% vs. previous period, mainly because traffic fell 29.83% |
| 7 days | Up 22.35%, with both customers and traffic rising |
| Conversion (calculated from dashboard) | Up in both time frames |
| Operations | Chat satisfaction 58.06% — below threshold |
Analysis: where the growth came from
Breaking GMV into visitors × conversion rate × GMV per customer, calculated from the dashboard data.
28-day frame (−12.94%):
- Visitors: −29.83%.
- Conversion rate: about +22%.
- GMV per customer: about +2%.
Multiplied together: 0.70 × 1.22 × 1.02 ≈ 0.87, consistent with −12.94%. Higher conversion “cushioned” most of the traffic drop.
7-day frame (+22.35%):
- Visitors: +6.00%.
- Conversion rate: about +14.5%.
- GMV per customer: about +1%.
Multiplied together: 1.060 × 1.145 × 1.008 ≈ 1.22, consistent with +22.35%. The latest week grew mainly thanks to better conversion, with traffic only recovering slightly.
On SKU orders moving in the opposite direction: over 28 days, SKU orders rose 104% even though customers fell. Over 7 days, SKU orders fell 20.72% even though customers rose. Items per customer climbed very high and then gradually came down. The dashboard home page does not show the cause. Possibilities to check: multi-item purchase promotions, bundles or gifts counted as separate SKUs, changes in the product mix. So in this case, GMV and customer count are more reliable measures than SKU orders.
Weak spot and how to address it — chat at 58.06%: with more than 100,000 customers every 28 days, message volume is very large. Customers who wait too long after messaging are more likely to cancel, leave low ratings or complain. The dashboard lists only 1 metric below threshold, and it is this one — the reason store health is at “Needs improvement”. The fix: template replies, chat shifts, and prioritizing order-related messages.
Lessons for store owners
- Always read at least 2 time frames. 28 days for the trend, 7 days for the latest signal.
- Compare average daily GMV across time frames to see whether this week is faster or slower than the baseline.
- When metrics move in opposite directions, find the cause before concluding. SKU order counts can be affected by how products are configured.
- Rising conversion is a healthy signal, even when traffic falls after a peak.
- The bigger the store, the more chat matters. Invest in a message-reply process before adding more traffic.
Actual results depend on the product, price, inventory, budget and platform policies. This is not a commitment to results for every client.
Is this your situation?
- The store already sells tens of billions of VND a month; a single down month is enough to unsettle the whole team.
- The 28-day figure shows a decline, but we cannot tell whether this week is improving or still falling.
- Hundreds of messages a day; staff cannot reply fast enough and customers complain about slow responses.
- SKU orders and customer counts move in opposite directions, and we do not know which metric to trust.
LDH Media audits your store or ad account for free and points out the 3 things to fix first — based on real data, not sales promises.
Project images & data


Services delivered