TikTok Shop operations4 min read
Background & challenge
This is a TikTok Shop store that already has a large audience. The brand name and category are withheld by agreement.
For many stores, the hardest part is getting viewers. But once traffic is there, the question changes: how do you turn viewers into buyers, and get them to buy more.
Situations store owners commonly face at this stage:
- Views soar, but orders grow more slowly.
- More ad budget brings more traffic, but the purchase rate drops.
- As orders pile up, dispatch starts to get overloaded.
Goal: ride the traffic momentum to grow GMV, while keeping conversion from falling too far.
Diagnosis from the data
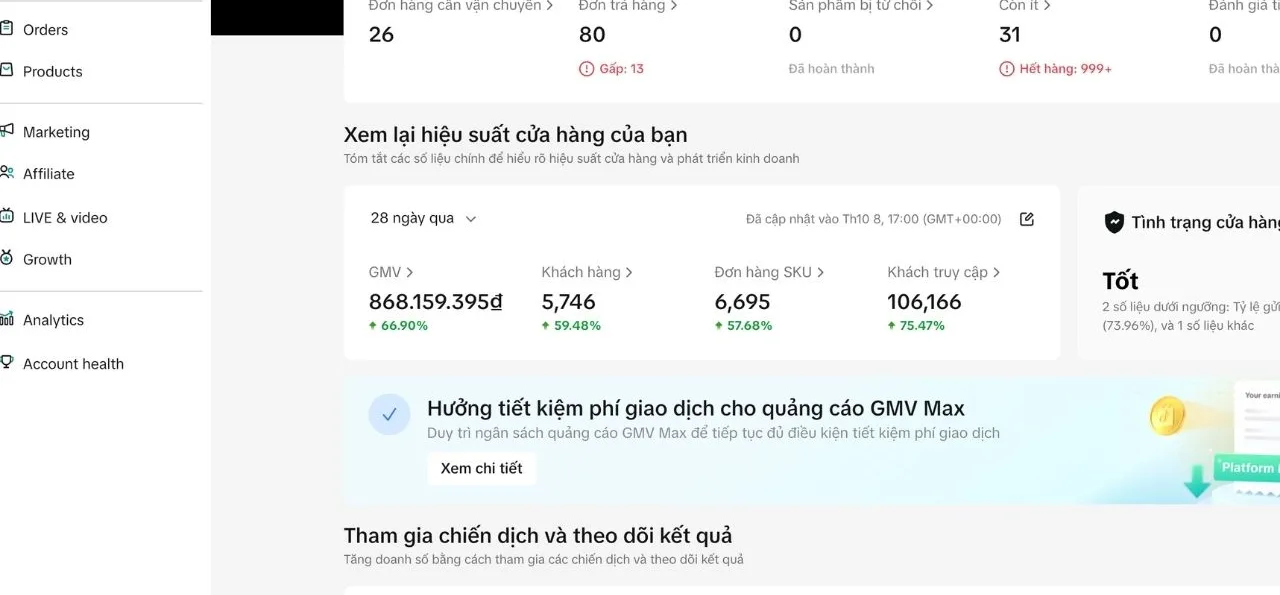
“Last 28 days” dashboard (updated Oct 8, 2026): GMV 868,159,395 VND (+66.90%), customers 5,746 (+59.48%), SKU orders 6,695 (+57.68%), visitors 106,166 (+75.47%).
Metrics calculated from the dashboard data (the previous period is back-calculated from the %, so these are estimates):
- Conversion rate: about 5.41%. Previous period about 5.95%.
- GMV per customer: about 151,100 VND. Previous period about 144,400 VND.
- GMV per SKU order: about 129,700 VND. Previous period about 122,500 VND.
- GMV per visitor: about 8,200 VND. Previous period about 8,600 VND.
- Previous-period GMV: about 520 million VND. The increase is about 348 million VND.
The good news: traffic grew the most (+75.47%) and value per order rose too. New customers did not drag order value down.
The “bottleneck”: conversion rate fell about 9% (from about 5.95% to 5.41%). For every 100 people visiting the store, nearly 6 bought last period; this period about 5.4. In addition, store health is Good but 2 metrics are below threshold, one at 73.96%.
Growth strategy
The framework LDH Media applies to “high traffic, conversion needs optimizing” stores. No client-specific details are disclosed.
Phase 1 — Plug the conversion leaks
- In Analytics, find products with many views but few orders.
- Fix those product pages first: main image, title, displayed price, reviews.
- Check stock on best-selling SKUs — a visitor who finds an item out of stock is lost conversion.
- Set clear order-threshold vouchers, displayed right on the product page.
Phase 2 — Improve traffic quality
- Prioritize videos that clearly show what problem the product solves, rather than pure entertainment.
- Separate videos that drive traffic from videos that drive orders — concentrate budget on the order-driving group.
- With GMV Max, track cost per order daily, not just impressions.
Phase 3 — Scale and handle the load
- Increase budget in steps once conversion has been stable for at least a few days.
- Add new videos regularly so the store does not depend on a few videos that are currently performing well.
- Fix below-threshold operational metrics before major order surges.
Results
| Metric | Result | vs. previous 28 days |
|---|---|---|
| GMV | 868,159,395 VND | +66.90% |
| Customers | 5,746 | +59.48% |
| SKU orders | 6,695 | +57.68% |
| Visitors | 106,166 | +75.47% |
| Conversion rate (calculated from dashboard) | about 5.41% | about −9% |
| Store health | Good | 2 metrics below threshold |
The original Seller Center dashboard screenshot is at the top of the article.
Analysis: where the growth came from
Breaking GMV into visitors × conversion rate × GMV per customer, calculated from the dashboard data:
- Visitors: +75.47% — the main driver.
- Conversion rate: about −9%.
- GMV per customer: about +5%.
Multiplied together: 1.755 × 0.909 × 1.047 ≈ 1.67, consistent with the +66.90% GMV.
What the numbers mean:
- Traffic is the engine, conversion is the brake. Had conversion held at last period’s level (about 5.95%), the same traffic could have produced about 10% more customers — an estimate, not something that actually happened.
- Conversion of about 5.4% is still a fairly good level. A slight dip when traffic grows 75% is common, because more viewers do not yet match the need. It is only worrying if it keeps falling over several periods.
- Rising order value shows the store did not have to discount to attract customers. That is a solid base for further scaling.
Weak spots and how to address them:
- 2 operational metrics below threshold, one at 73.96%. As orders increase further, these metrics tend to deteriorate. Open Account Health to see the name and threshold of each metric, then address them in order of impact.
- Traffic dependence. If much of the traffic comes from a few videos, GMV will fall when those videos “tire out”. New content needs to be added regularly.
Lessons for store owners
- Calculate conversion rate every week as customers ÷ visitors. This number tells you how well the store “holds on to” viewers.
- Rising traffic with slightly lower conversion is normal. A steep or sustained drop is the signal that something needs fixing.
- Fix the most-viewed product pages first, because that is where each percentage point of conversion is worth the most.
- Measure videos by orders, not views.
- Fix operational metrics before scaling.
Actual results depend on the product, price, inventory, budget and platform policies. This is not a commitment to results for every client.
Is this your situation?
- Videos went trending and lots of people came to the store, but orders did not grow accordingly.
- More ad spend brought more views, but orders only edged up, and we did not know where the leak was.
- We did not know whether our store's conversion rate was high or low, so we could not fix it.
- As orders picked up, the warehouse and dispatch started to struggle, and Seller Center metrics dropped.
LDH Media audits your store or ad account for free and points out the 3 things to fix first — based on real data, not sales promises.
Project images & data


Services delivered