GMV Max · TikTok Shop Ads5 min read
Context & challenge
This is a TikTok Shop store that had barely run GMV Max. In the three months before the reporting period, GMV Max spend was only a few million VND and orders from ads numbered only a few dozen. The brand name and category are withheld by agreement.
This situation is very familiar to new store owners. Products are listed, videos exist, but as soon as ads are switched on, cost per order looks high. Many people switch off the campaign after a few days. The algorithm is stopped before it has had time to learn.
The goals for the 11/07 – 09/10/2026 period were clear:
- Give GMV Max enough time and enough data to learn.
- Bring cost per order down to an acceptable level.
- Turn ads into a channel that brings in orders steadily, rather than “try and switch off”.
Diagnosis from the data
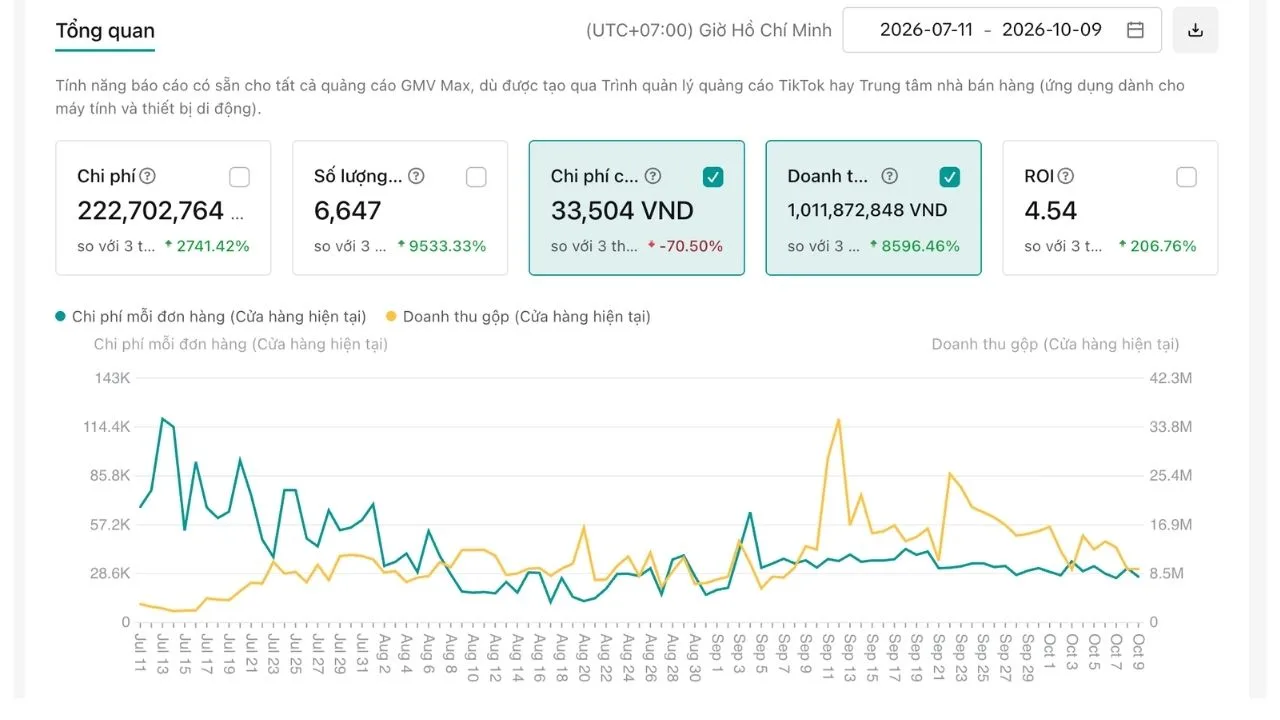
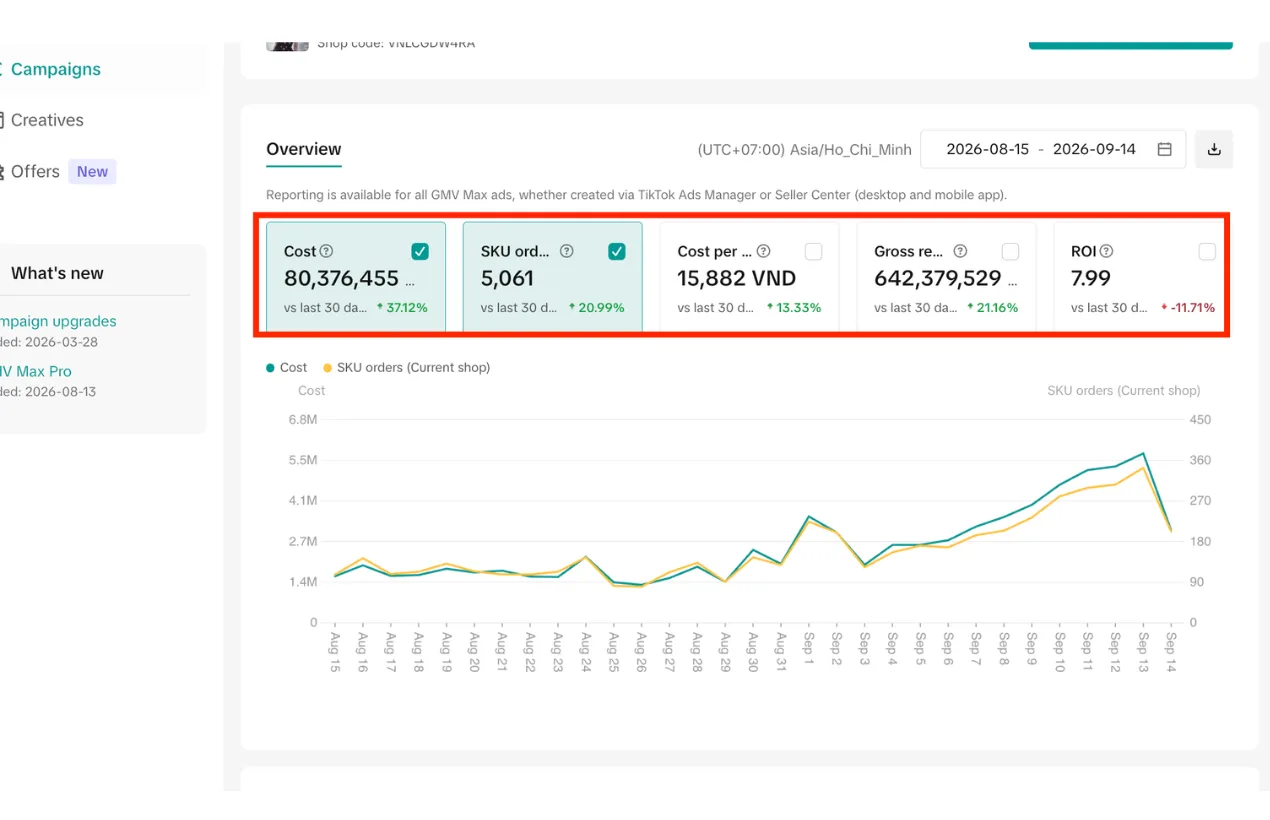
GMV Max dashboard for 11/07 – 09/10/2026, compared with the previous 3 months:
- Spend: 222,702,764 VND (+2,741.42%).
- Orders: 6,647 (+9,533.33%).
- Cost per order: 33,504 VND (−70.50%).
- Revenue: 1,011,872,848 VND (+8,596.46%).
- ROI: 4.54 (+206.76%).
From these percentages, the previous period can be worked out backwards (estimates, calculated from the dashboard data):
| Metric | Previous 3 months (estimate) | This period |
|---|---|---|
| Spend | ≈ 7.8 million VND | 222.7 million VND |
| Orders | ≈ 69 | 6,647 |
| Cost per order | ≈ 113,600 VND | 33,504 VND |
| Revenue | ≈ 11.6 million VND | 1.01 billion VND |
| ROI | ≈ 1.48 | 4.54 |
| Average order value (AOV) | ≈ 168,600 VND | ≈ 152,200 VND |
AOV = revenue / orders, calculated from the dashboard data.
The good news: orders grew much faster than spend. Spend rose about 28 times, while orders rose about 96 times. That is a sign the algorithm has found its group of buyers.
The bottleneck: ROI 4.54 is still low compared with many other GMV Max dashboards. In categories with thin margins, this ROI may only be around break-even. The chart on the dashboard also shows that cost per order fluctuated sharply in the first weeks of July, exceeding 100 thousand VND on some days. From around mid-August, the cost-per-order line became more stable, sitting around the 30 thousand VND range.
Growth strategy
This is the framework LDH Media applies to stores just starting GMV Max. The details of each task are adjusted to the store’s actual products and budget.
Phase 1 – Foundation (data learning)
- Set the break-even ROI from each product’s profit margin before switching on ads.
- Choose a few hero products with clear prices and sufficient stock, instead of switching on the whole catalogue.
- Prepare enough sales videos so GMV Max has material to test.
- Accept a high cost per order in the first weeks, and don’t switch off campaigns on emotion.
Phase 2 – Activation (stabilising cost per order)
- Track cost per order daily, evaluate weekly.
- Keep the campaign configuration stable so the algorithm doesn’t have to relearn.
- Gradually replace weak videos with new ones using the same selling angles that already generated orders.
- Check the product page, price and promotions so viewers who click through find it easy to buy.
Phase 3 – Scale (controlled growth)
- Increase budget in steps once cost per order has been stable for several consecutive days.
- Use sale events to push revenue, then bring budget back to the baseline.
- Set a stop threshold: if cost per order stays above break-even, slow down.
- Review results at the 30 · 60 · 90-day milestones.
Results
| Metric | Result (11/07 – 09/10/2026) | Vs. previous 3 months |
|---|---|---|
| Spend | 222,702,764 VND | +2,741.42% |
| Orders | 6,647 | +9,533.33% |
| Cost per order | 33,504 VND | −70.50% |
| Revenue | 1,011,872,848 VND | +8,596.46% |
| ROI | 4.54 | +206.76% |
For reference, below is another GMV Max dashboard also at an early stage, when orders rose very sharply compared with the previous period:
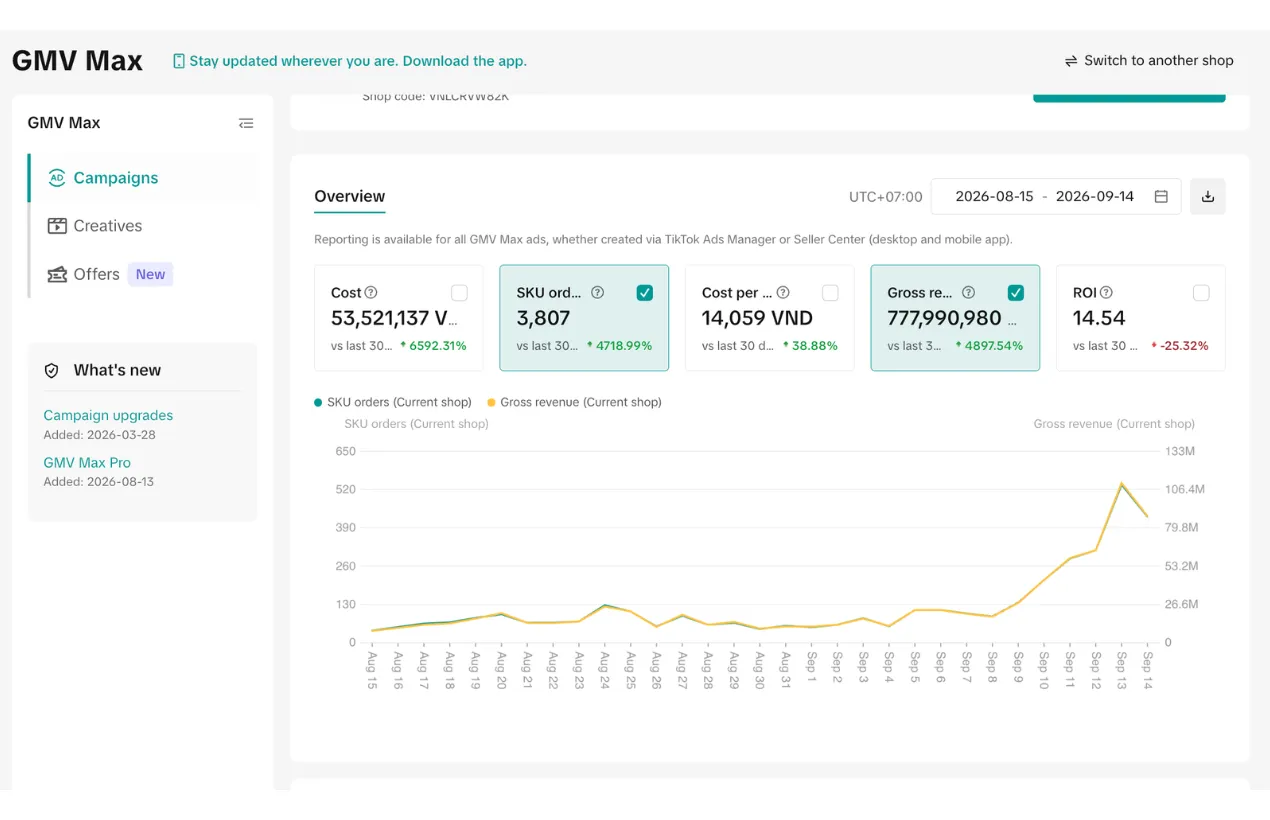
Both dashboards are in an acceleration phase, yet their ROI is far apart. The gap lies in both order value (≈ 204,000 VND vs. ≈ 152,200 VND) and cost per order (≈ 14,000 VND vs. 33,504 VND), calculated from the dashboard data. These two metrics depend heavily on product and price, not just on how the ads are run.
Analysis: where the growth came from
The GMV Max dashboard has no visitor count, so the conversion rate cannot be separated out. A more suitable breakdown is:
Revenue = Spend × (Orders per unit of spend) × Order value
Applied to this case (calculated from the dashboard data):
- Spend rose about 28.4 times.
- Order efficiency rose about 3.4 times, as cost per order fell from ≈ 113,600 VND to 33,504 VND.
- Order value fell about 10%, from ≈ 168,600 VND to ≈ 152,200 VND.
Multiplied together: 28.4 × 3.4 × 0.9 ≈ 87 times, matching the revenue increase of +8,596.46%.
So most of the growth came from adding budget once the algorithm had learned how to generate cheaper orders. Had cost per order stayed at ≈ 113,600 VND, the same 222.7 million VND would have bought only about 1,960 orders (estimate), instead of 6,647.
The weaker points, stated plainly:
- ROI 4.54 is not high. It is the lowest of the 17 GMV Max dashboards LDH Media compiled in the benchmark article. The store needs to compare it with real profit margins to know how much it earns after ads.
- Order value dipped slightly. The algorithm tends to find easy-to-close orders, usually lower-priced products. The fix: add bundles, free gifts or a free-shipping threshold to lift AOV.
- Daily revenue still fluctuates. The chart shows revenue spiking around mid-September, then gradually declining. New videos need to be added regularly so the store doesn’t depend on a few pieces of content that happen to be performing well.
Lessons for store owners
- Don’t judge GMV Max after a few days. In this case, cost per order fell 70.50% as the algorithm gained more data. Switching off early throws that learning away.
- Calculate break-even ROI before switching on. ROI 4.54 may be profitable in this category but loss-making in another. Use gross margin as the benchmark.
- Track cost per order, not just ROI. A steadily falling cost per order is a good signal to raise budget gradually.
- Work on order value alongside the ads. Bundles and gifts help each order bring in more money for the same spend.
- Prepare videos before scaling. GMV Max needs material. With few videos, the algorithm “fatigues” quickly.
Actual results depend on product, price, inventory, budget and platform policies. This is not a commitment to results for every client.
Is this your situation?
- The store has listed products and has a few videos, but after a few days of GMV Max the money goes out while orders only trickle in.
- Cost per order in the first days is almost as high as the profit on one order, so you don't dare keep the ads running.
- Every time the numbers look bad the campaign gets switched off, and when it is switched back on the algorithm seems to learn from scratch.
- You don't know what ROI means break-even for your product, so you just guess from the numbers on the dashboard.
LDH Media audits your store or ad account for free and points out the 3 things to fix first — based on real data, not sales promises.
Project images & data


Services delivered