GMV Max · TikTok Shop Ads5 min read
Context & challenge
Dế Mèn Vi Sinh sells microbial products on TikTok Shop. This is a moderately priced product group that customers buy based on actual usage needs.
Before this period, GMV Max ads were already running, but at a small scale. The challenge in scaling the ads was growing orders while keeping cost per order within what the profit margin can bear.
With a product that isn’t expensive, a cost-per-order increase of just a few thousand VND visibly thins the profit on each order. So the goals were set precisely:
- Sharply increase orders from ads over about 6 months from 04/2026.
- Not let cost per order rise as budget rose.
- Keep ROI close to its previous level even at a scale many times larger.
Diagnosis from the data
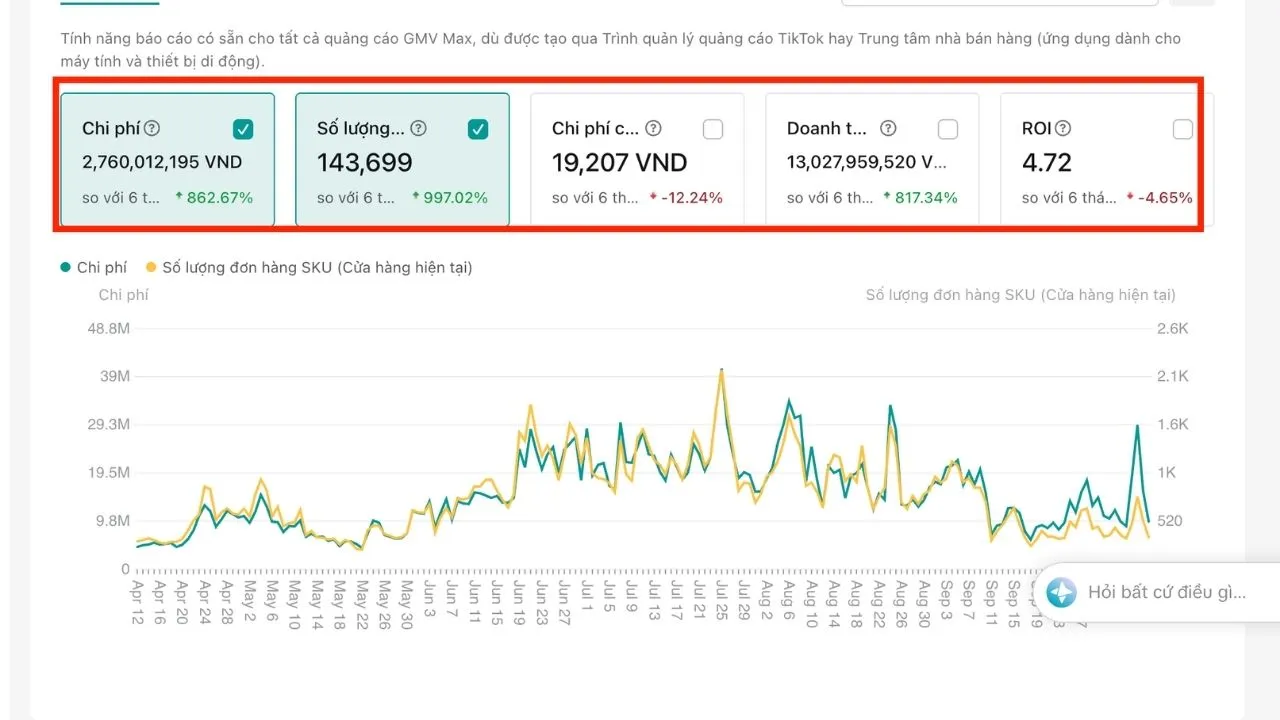
GMV Max dashboard, about 6 months from 04/2026, compared with the previous 6 months:
- Ad spend: 2,760,012,195 VND (+862.67%).
- SKU orders: 143,699 (+997.02%).
- Cost per order: 19,207 VND (−12.24%).
- Revenue: 13,027,959,520 VND (+817.34%).
- ROI: 4.72 (−4.65%).
The previous 6 months worked out backwards (estimates, calculated from the dashboard data):
| Metric | Previous 6 months (estimate) | This period |
|---|---|---|
| Spend | ≈ 286.7 million VND | 2.76 billion VND |
| SKU orders | ≈ 13,100 | 143,699 |
| Cost per order | ≈ 21,900 VND | 19,207 VND |
| Revenue | ≈ 1.42 billion VND | 13.03 billion VND |
| ROI | ≈ 4.95 | 4.72 |
| Average order value (AOV) | ≈ 108,400 VND | ≈ 90,700 VND |
The good signs: orders grew faster than spend. As a result, cost per order fell 12.24% even though budget rose almost 10 times. This is rare when scaling.
The bottleneck: order value fell about 16%. Orders were more numerous and cheaper, but each order brought in less money. That is why ROI still dipped slightly, by 4.65%, even though cost per order fell.
Growth strategy
This is the framework LDH Media applies to stores with moderately priced products that need to sell in large volume.
Phase 1 – Foundation: set the right yardstick
- Optimise for order count and cost per order, not revenue at any cost.
- Calculate the maximum acceptable cost per order from the profit margin.
- Prepare packing and delivery capacity before raising budget.
Phase 2 – Activation: grow in step
- Raise spend and track orders moving in step. The chart shows spend and orders rising in parallel from April to the end of July 2026.
- Add how-to-use videos and before–after videos so the algorithm has more material.
- Keep the campaign configuration stable so the algorithm doesn’t have to relearn.
Phase 3 – Scale: adjust to market signals
- Evaluate by cost per order, not only by overall ROI.
- When orders can’t keep up with spend, slow down instead of pushing harder.
- Look for ways to raise order value with bundles, longer-use packs or free gifts.
Results
| Metric | Result | Vs. previous 6 months |
|---|---|---|
| Ad spend | 2,760,012,195 VND | +862.67% |
| SKU orders | 143,699 | +997.02% |
| Cost per order | 19,207 VND | −12.24% |
| Revenue | 13,027,959,520 VND | +817.34% |
| ROI | 4.72 | −4.65% |
Orders grew faster than spend, so cost per order fell 12.24% even though budget rose almost 10 times. ROI held almost steady as scale grew — the hardest thing to achieve when scaling ads.
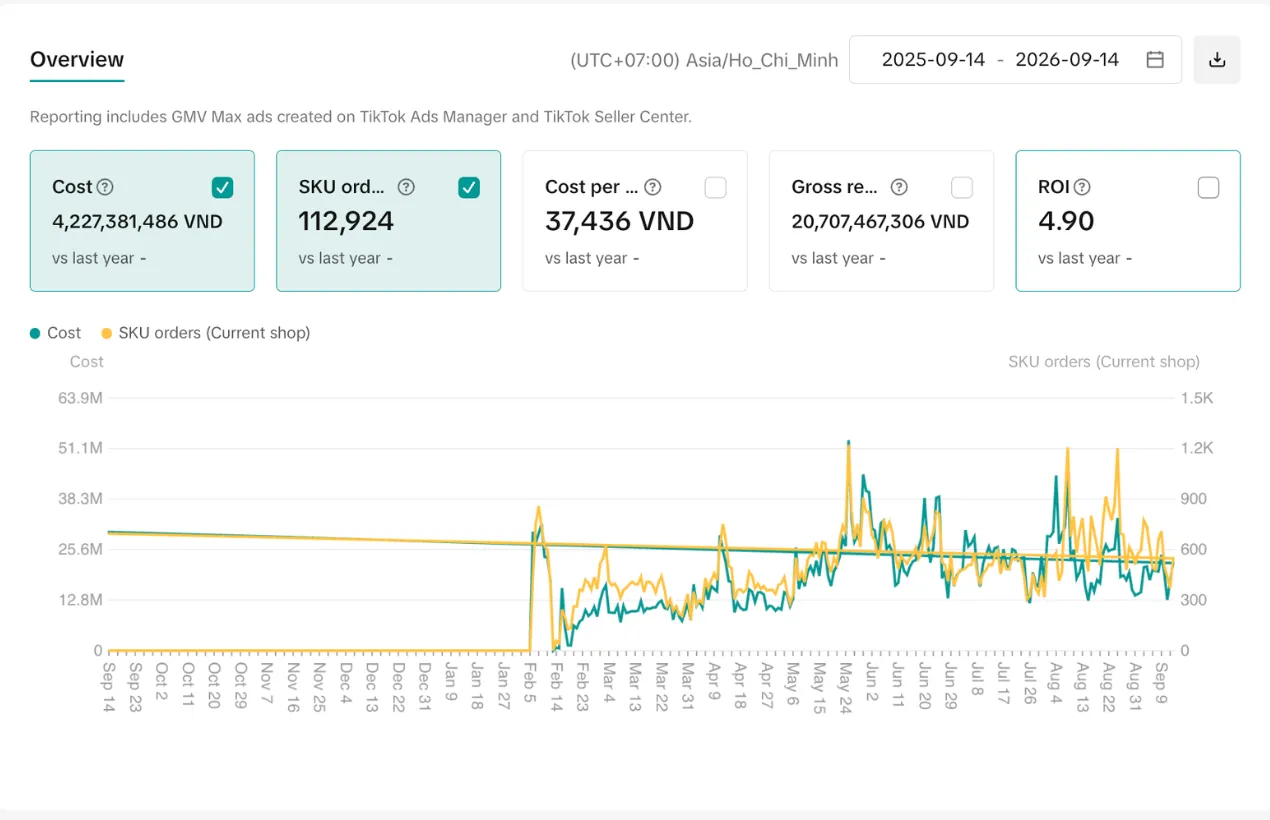
For comparison, here is another GMV Max dashboard with ROI in the same range (4.90) but a higher order value:
Analysis: where the growth came from
The GMV Max dashboard has no visitor count, so revenue is broken down as:
Revenue = Spend × (Orders per unit of spend) × Order value
Calculated from the dashboard data:
- Spend rose about 9.6 times.
- Order efficiency rose about 14%, as cost per order fell 12.24%.
- Order value fell about 16%.
Multiplied together: 9.6 × 1.14 × 0.84 ≈ 9.2 times, matching the revenue increase of +817.34%.
Growth came mainly from a larger budget, supported by a lower cost per order. The fall in order value pulled in the opposite direction.
Marginal ROI on the extra spend (estimated from the dashboard):
- Extra spend ≈ 2.47 billion VND.
- Extra revenue ≈ 11.61 billion VND.
- Marginal ROI ≈ 4.69, almost equal to the average ROI.
A marginal ROI close to the average ROI means the extra budget performed almost as well as the original budget. This is a sign of healthy scaling.
The weaker points:
- Order value fell about 16%. As the audience widened, the algorithm found more buyers of smaller packs. The fix: push bundles, value packs and order-value threshold offers.
- Performance was less even towards the end of the period. From September 2026, daily spend and orders declined from the July peak. On some days spend rose sharply while orders rose less. Close monitoring is needed to avoid spending on slow market days.
- ROI 4.72 needs to be checked against profit margin. With a moderately priced product, you need to be sure this ROI is still above break-even after cost of goods and platform fees.
Lessons for store owners
- For moderately priced products, cost per order is the vital metric. Track it daily, not just ROI.
- Good scaling is when orders grow faster than spend. In this case orders rose 997.02% while spend rose 862.67%.
- Calculate marginal ROI when raising budget. If marginal ROI stays close to average ROI, the extra spend is still worth it.
- Work on order value in parallel. Bundles and larger packs help offset the drop in order value when the audience widens.
- Prepare warehouse and delivery before scaling. Orders growing almost 11 times without operations keeping up will drag down the store’s ratings.
Actual results depend on product, price, inventory, budget and platform policies. This is not a commitment to results for every client.
Is this your situation?
- The product isn't expensive and the profit per order is small, so if ad cost creeps up even a little, the profit is gone.
- You want to sell more but worry that raising the budget will push cost per order up.
- An ROI around 5 looks low compared with what you hear online, and you don't know whether that's good or bad.
- When orders grow fast, you worry that packing and delivery can't keep up.
LDH Media audits your store or ad account for free and points out the 3 things to fix first — based on real data, not sales promises.
Project images & data


Services delivered